M1 money supply is rising at nearly 70% year over year
What is going on and does this mean inflation is coming?
Shorter Answer: No
Longer Answer: Not from the monetary channel
1)
What is going on and does this mean inflation is coming?
Shorter Answer: No
Longer Answer: Not from the monetary channel
1)
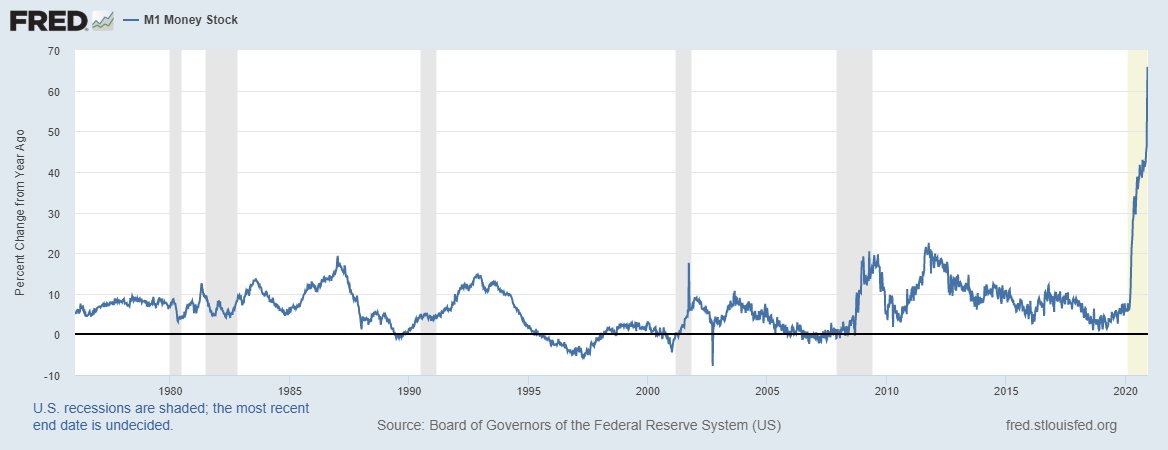
Money supply started to accelerate at the end of March, almost 9 months ago
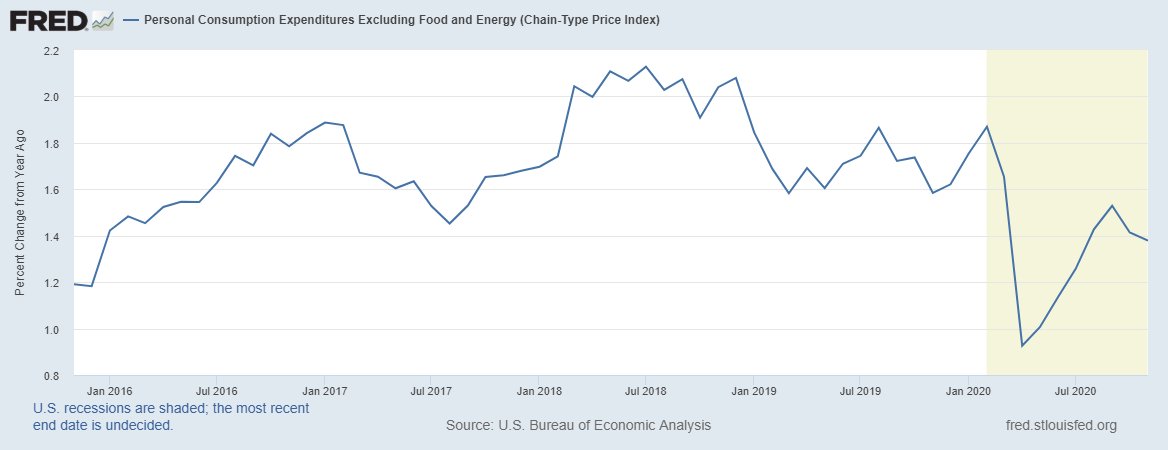
Inflation was the concern at the time.
"Not in the short-term" but over the long-run was the phrase
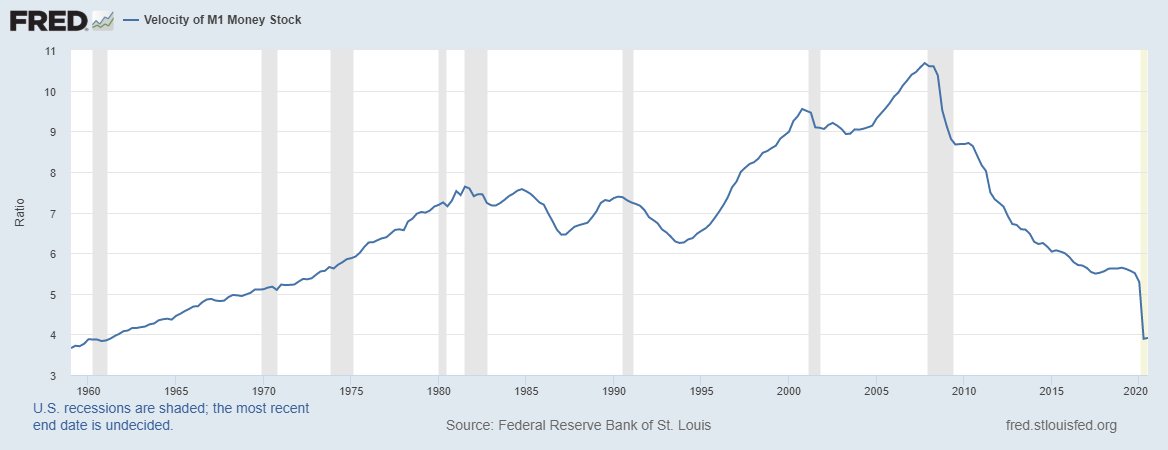
9 months later & inflation is lower than when the pandemic started because velocity collapsed
2)
Inflation was the concern at the time.
"Not in the short-term" but over the long-run was the phrase
9 months later & inflation is lower than when the pandemic started because velocity collapsed
2)
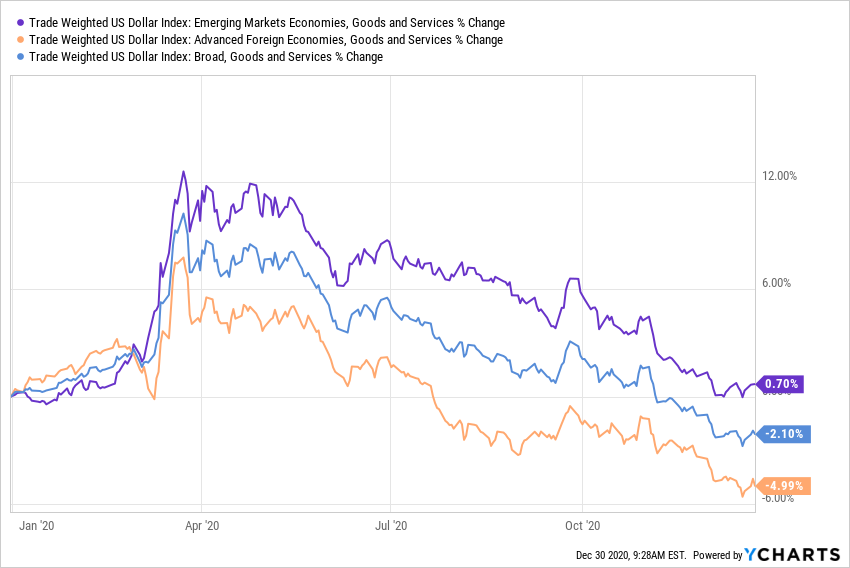
There is a cyclical upturn ongoing in the manufacturing sector which is giving rise to "goods" inflation but that is wholly separate from the (lack of) inflation emerging from the monetary channel that many fear with posts of M1 or M2 money growth.
3)
https://twitter.com/EPBResearch/status/1336028353946521601?s=20
3)
For inflation to emerge from the monetary channel, we need to see rising money growth with *at least* stable velocity and increasing bank loans.
Right now, only condition #1 is satisfied which is why inflation is declining with record money growth.
4)
Right now, only condition #1 is satisfied which is why inflation is declining with record money growth.
4)
M1 money supply is rising nearly 70% year over year compared to M2 growth which is rising about 25% year over year.
5)
5)
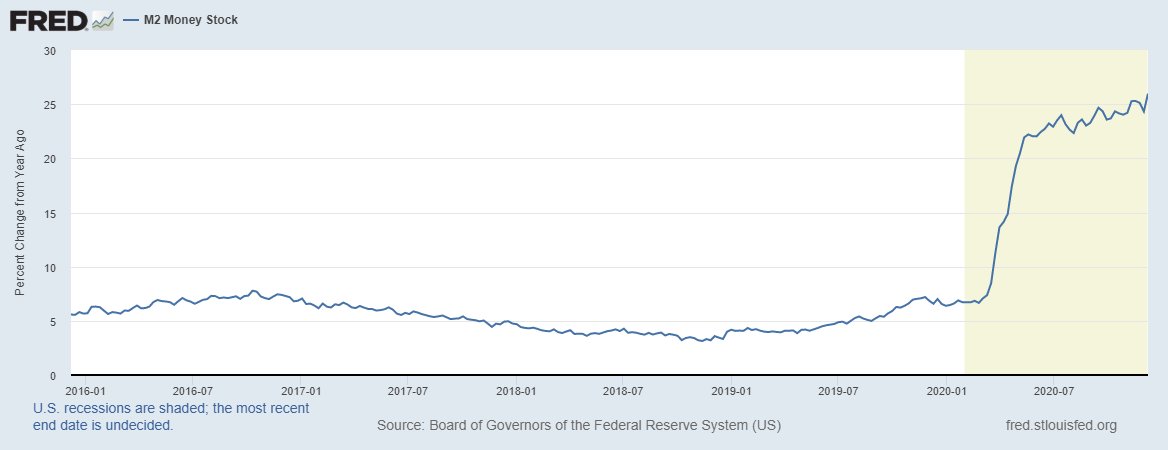
Money is simply shifting around from "savings" accounts to "checking" accounts which moves money from M2 to M1.
Charted below we can see demand deposits are growing over 100% year over year.
6)
Charted below we can see demand deposits are growing over 100% year over year.
6)

M2 contains more "savings" compared to M1. The Non-M1 Components of M2 showed declining growth, falling from almost 20% year over year growth to ~12%.
7)
7)

Essentially, money moved from savings accounts to checking accounts which caused a surge in M1 growth.
To the extent the money is used to pay down debt, or used for basic needs like clothing, food & shelter, then M1 velocity will take another leg lower, offsetting inflation
8)
To the extent the money is used to pay down debt, or used for basic needs like clothing, food & shelter, then M1 velocity will take another leg lower, offsetting inflation
8)

Inflation will continue to build as long as there is a cyclical upturn in the global industrial sector.
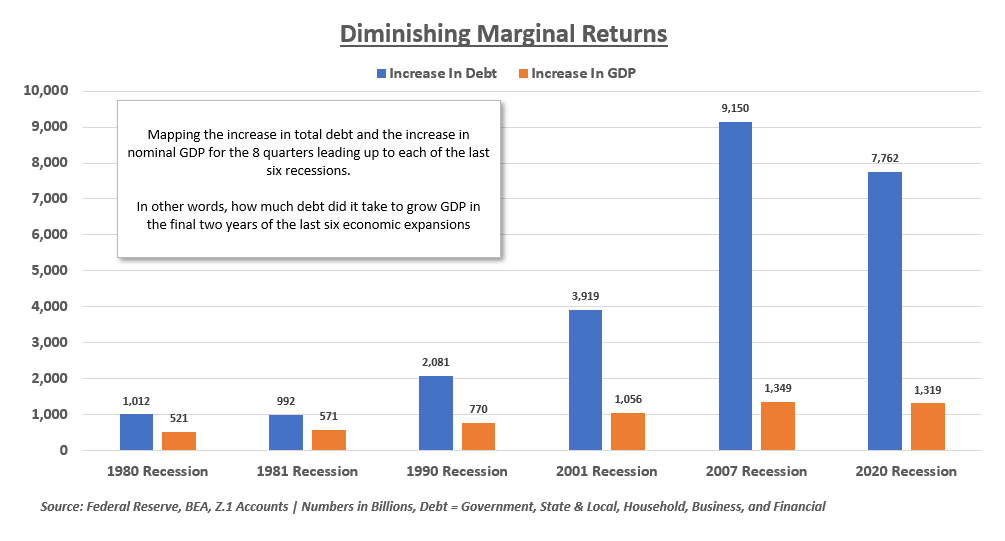
Using government debt to drive resources (away from investment) and towards consumption will not result in the inflationary increase many expect.
9)
Using government debt to drive resources (away from investment) and towards consumption will not result in the inflationary increase many expect.
9)
Rather, we'll continue to depress the rate of private investment leading to no increase in the standard of living.
In high-debt societies, the inflation rate is highly correlated to real GDP growth.
10)
In high-debt societies, the inflation rate is highly correlated to real GDP growth.
10)
With some cyclical ups and downs our current economic and political strategy will lead to the rate of inflation piling up on top of real GDP growth in the 1% range on average.
We'll sink into mild deflation when there is a commodity bust (late 2015 as an example)
11)
We'll sink into mild deflation when there is a commodity bust (late 2015 as an example)
11)
The monetary inflation comes when we no longer issue debt to spend at the government level which means money supply growth will increase and velocity won't decline as there is no new debt-load to weigh on velocity.
A topic for another day.
12)
A topic for another day.
12)
• • •
Missing some Tweet in this thread? You can try to
force a refresh