Diminishing Marginal Returns

The productivity of our debt is collapsing and that is creating a major problem.

The problem is here now, and not in the future.

Here is why:

1)
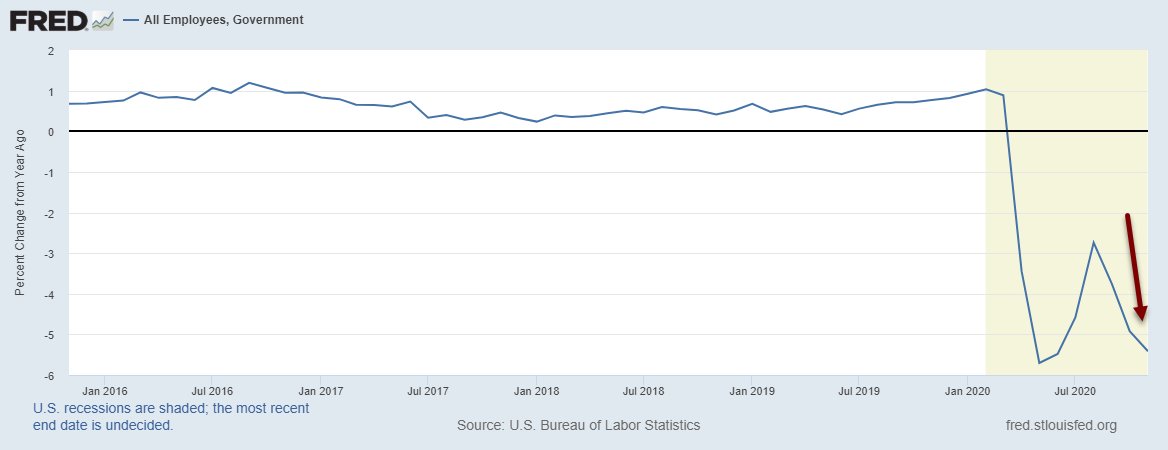
Charted below is the increase in total debt and the increase in nominal GDP in the 8 quarters before each of the last six recessions.

In other words, how much did debt increase, and how much did GDP increase in the final two years of each economic expansion?

2)
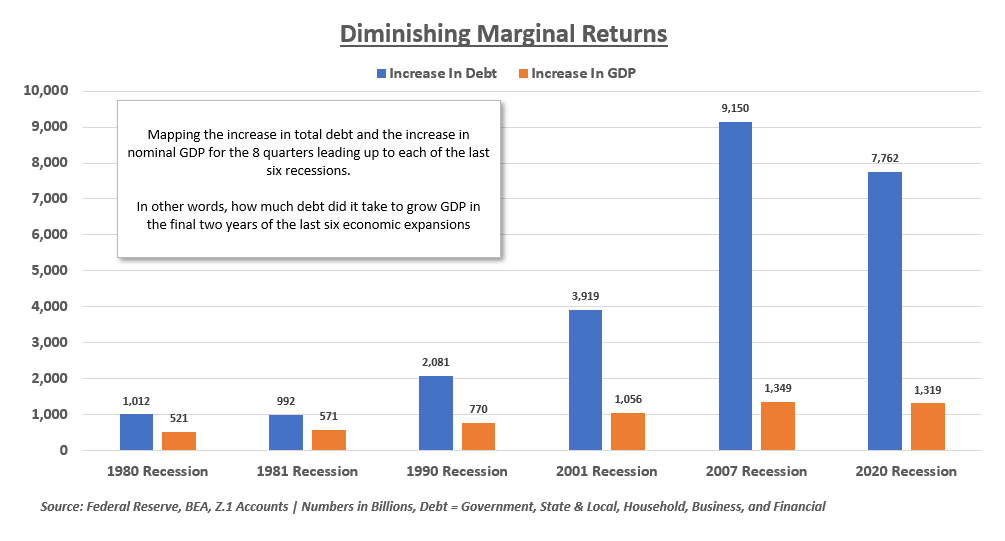
As the chart shows, it is taking a larger amount of debt to increase GDP.

3)
Graphed another way, leading up to the 1980 recession it took about 1.94 dollars of debt to boost GDP by 1 dollar.

Leading up to the COVID recession saw debt increase nearly 6 dollars for each 1 dollar of GDP growth.

4)
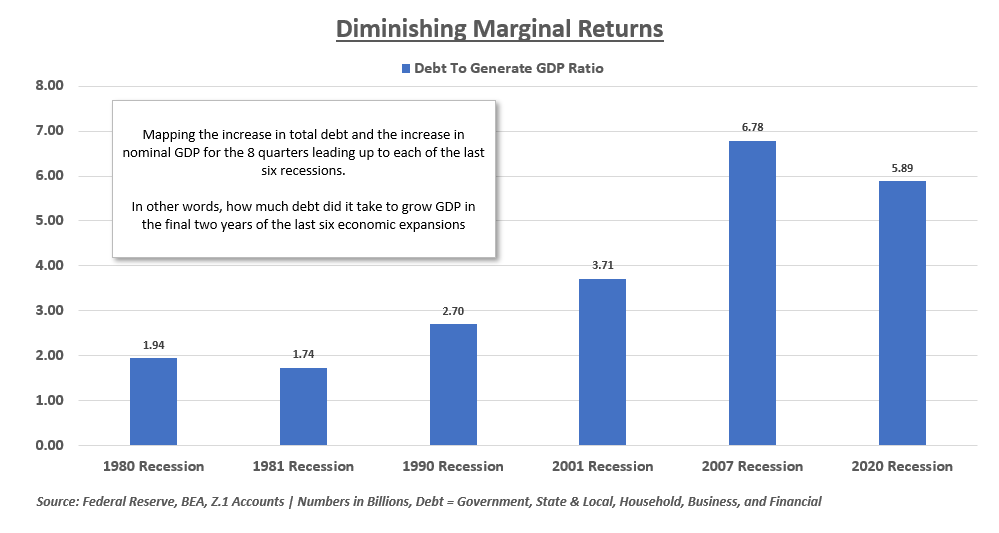
Flipping the ratio shows the decline in the utility of debt.

We are only generating about 15-20 cents of growth for each dollar of debt.

This becomes a larger problem when we think about "growth rates" instead of nominal dollars.

5)
Before the 2007 recession, it took about $9T of debt to increase GDP by $1.3T. Or, it took about $9T of debt to increase nominal GDP by 4.9%/year in those two years.

The same $1.3T increase in nGDP only translated to a 3.2% growth rate per year leading up to 2020.

6)
In other words, $9T of debt got us ~5% nominal growth in 2005-2007 and only ~3% in 2018-2020.

The problem is here now because we know it will take about $10T of new debt to increase GDP by $1.5T.

That would only be an increase in growth of 3% nominal per year.

7)
As we continue to press down on this diminishing marginal returns curve, we will find ourselves using 8-10 units of debt for each dollar of growth, each dollar that generates a lower "growth rate" on a higher base.

8)
With any political division, Congress will not be able to authorize the spending needed to increase GDP by the same ~3% per year as the numbers are simply getting too large.

$10T in total debt growth won't even get us 3% nominal.

9)
If we have just 2% inflation then $10T in new debt will only lead to about 1% real growth.

At this stage of the game, no amount of government spending will translate to an increase in the standard of living (real GDP per capita).

The nonlinear decline continues.

10/10

• • •

Missing some Tweet in this thread? You can try to force a refresh
 

Keep Current with Eric Basmajian

Eric Basmajian Profile picture

Stay in touch and get notified when new unrolls are available from this author!

Read all threads

This Thread may be Removed Anytime!

PDF

Twitter may remove this content at anytime! Save it as PDF for later use!

Try unrolling a thread yourself!

how to unroll video
  1. Follow @ThreadReaderApp to mention us!

  2. From a Twitter thread mention us with a keyword "unroll"
@threadreaderapp unroll

Practice here first or read more on our help page!

More from @EPBResearch

30 Dec
US Dollar Trends

The Fed Trade Weighted Dollar Index fell another 1% over the past month.

The decline was led by the dollar falling against advanced economies as the dollar was down less against emerging market economies

1) Image
The Fed's trade-weighted indexes are my preferred US dollar aggregates, far better than popular measures like the $DXY due to the concentration

The USD is down 7% across the board in the last six months.

2) Image
Surprisingly, the USD is still up on the year relative to EM economies

With exceptions, the USD moves counter to global industrial growth

An industrial boom generally puts downward pressure on safe-haven dollars in exchange for more risk while economies are accelerating

3) Image
Read 7 tweets
28 Dec
M1 money supply is rising at nearly 70% year over year

What is going on and does this mean inflation is coming?

Shorter Answer: No

Longer Answer: Not from the monetary channel

1)
Money supply started to accelerate at the end of March, almost 9 months ago

Inflation was the concern at the time.

"Not in the short-term" but over the long-run was the phrase

9 months later & inflation is lower than when the pandemic started because velocity collapsed

2)
There is a cyclical upturn ongoing in the manufacturing sector which is giving rise to "goods" inflation but that is wholly separate from the (lack of) inflation emerging from the monetary channel that many fear with posts of M1 or M2 money growth.


3)
Read 12 tweets
23 Dec
Congress is threading the needle in terms of timing with the latest COVID relief package.

Personal income, after a massive surge, is about to fall below the pre-pandemic trendline.

Some thoughts on November's Personal Income & Outlays report:

1)
The most important metric for real consumption is real disposable personal income.

Real DPI spiked during the pandemic due to enhanced UI and stimulus checks.

Since April, real DPI has been declining as the withdrawal of stimulus has outpaced the increase in wages.

2)
Real personal income excluding transfer payments also declined in November which means the income drop was not just from a lack of stimulus, there was pressure to core income.

3)
Read 11 tweets
22 Dec
Why you should be expecting “worse than average”…

Graphed below is the trailing 10Y avg in real EPS and real GDP, indexed to 100 in 1990.

Real EPS massively outpaced real GDP (financial engineering gap).
S&P 500 management has done a remarkable job at keeping the long-term growth rate in real EPS between 5%-6%, despite weaker real GDP growth.

The long-term real return for the $SPX has been about 6% and the long-term growth in real EPS has been about 6%.
Over time, stocks track real EPS growth with a wildly varying, yet mean-reverting multiple.

How have managements boosted EPS to nearly 6% in a world of 2% real GDP growth? Tax changes and buybacks mostly.
Read 7 tweets
4 Dec
November Jobs Report Thread

There is both good news and bad news buried in the report.

Most often, too much attention is paid to the headline month on month numbers.

1)
2) In year over year terms, total nonfarm payrolls did not increase for the first time since the pandemic. Generally, this is a negative.
3) Under the hood, most of the decline was in the government sector so it makes more sense to look at private payrolls in this context.
Read 14 tweets
2 Dec
Bank credit is comprised of mostly "securities" and "loans"

Securities are mostly US Treasury bonds and Mortgage-backed securities (MBS).

Loans include real estate, C&I, credit cards etc.
1) Loans as a % of bank credit have plunged as banks continue to absorb USTs, crowding out private domestic investment.
2) Securities as a % of bank credit is at an all-time high.
Read 5 tweets

Did Thread Reader help you today?

Support us! We are indie developers!


This site is made by just two indie developers on a laptop doing marketing, support and development! Read more about the story.

Become a Premium Member ($3/month or $30/year) and get exclusive features!

Become Premium

Too expensive? Make a small donation by buying us coffee ($5) or help with server cost ($10)

Donate via Paypal Become our Patreon

Thank you for your support!

Follow Us on Twitter!