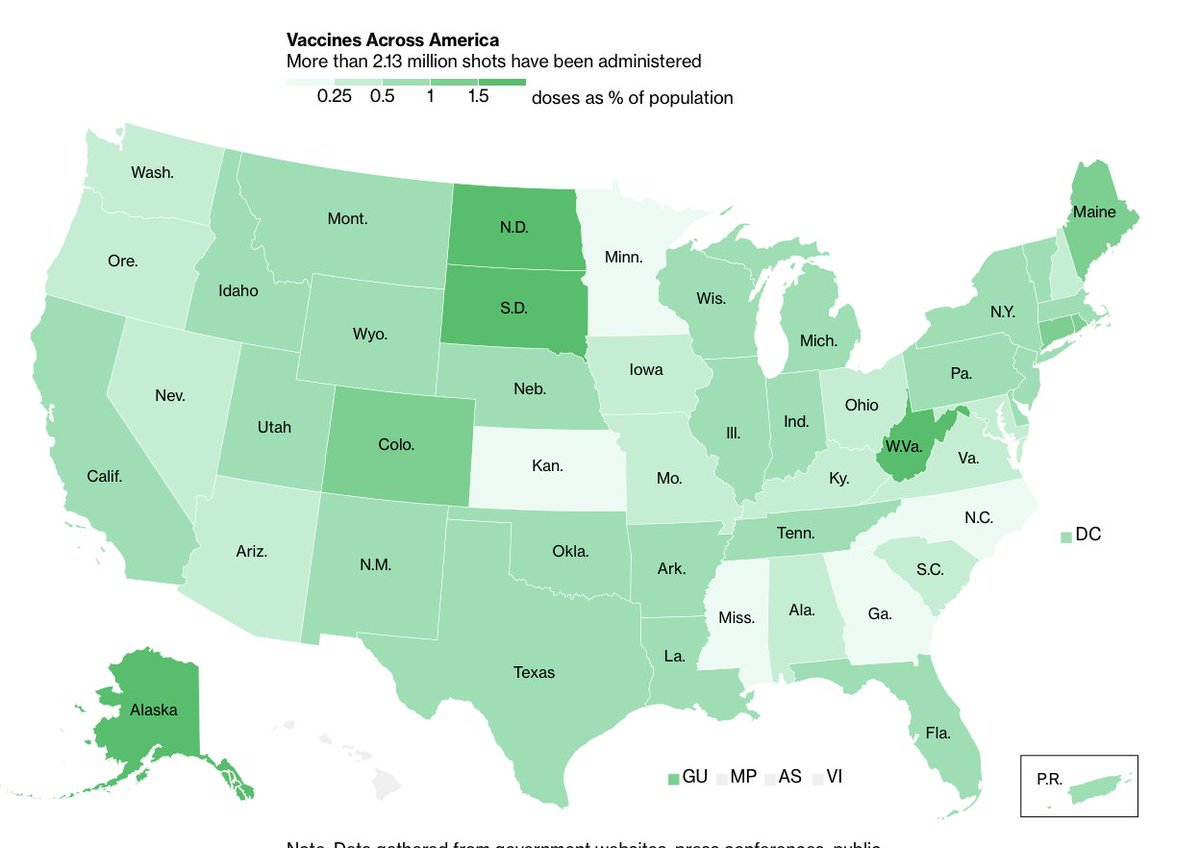
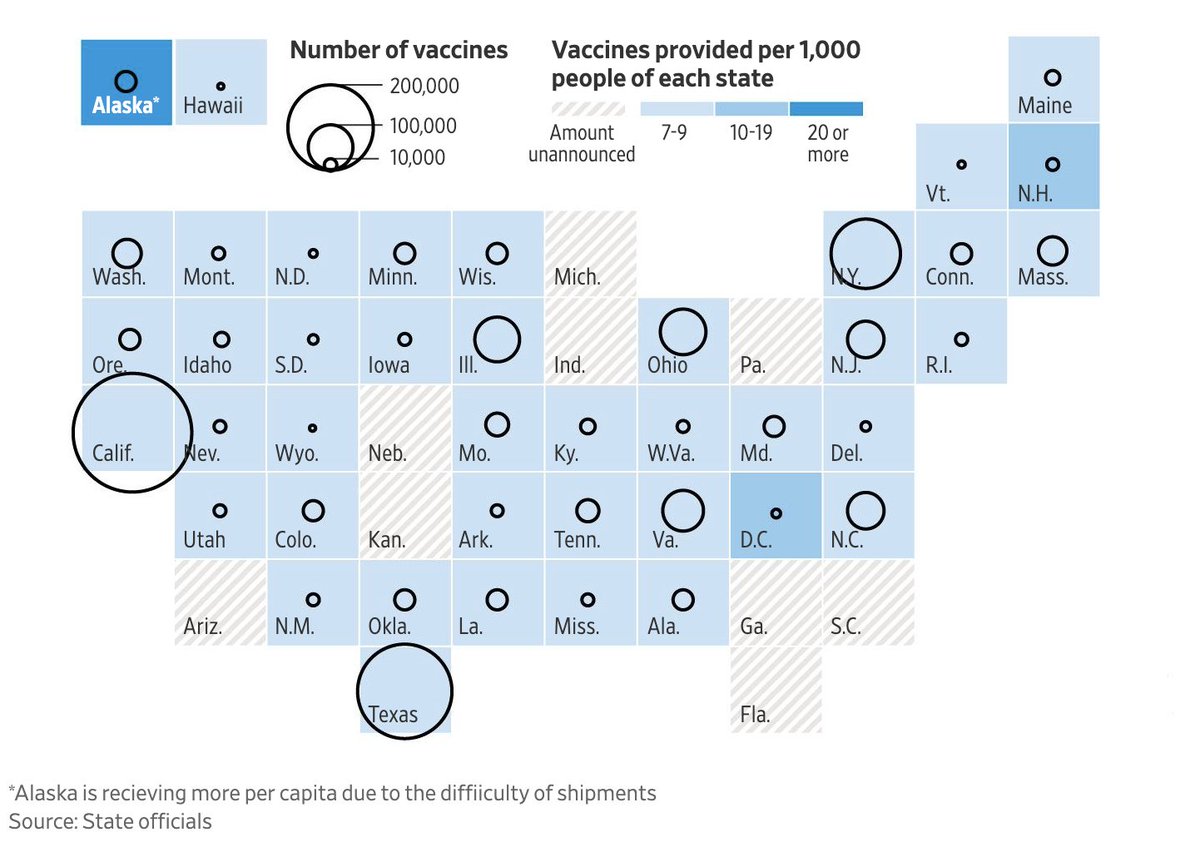
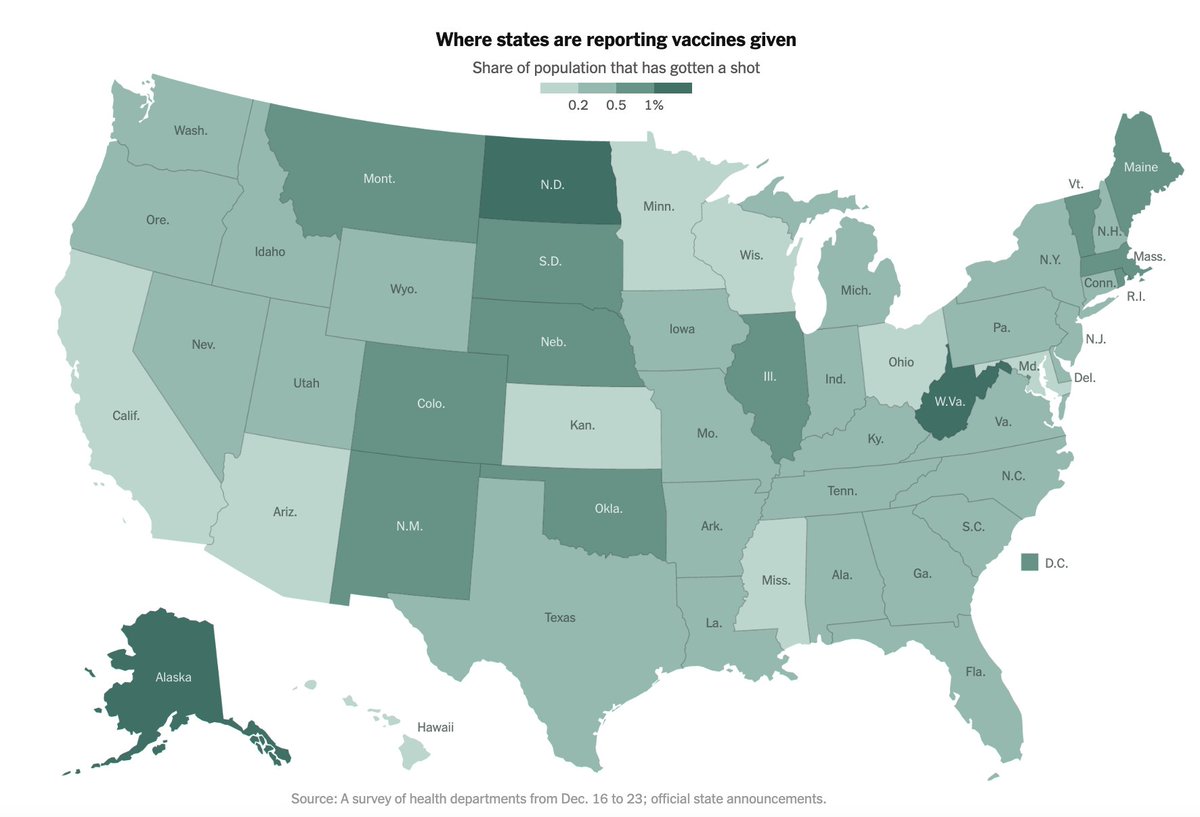
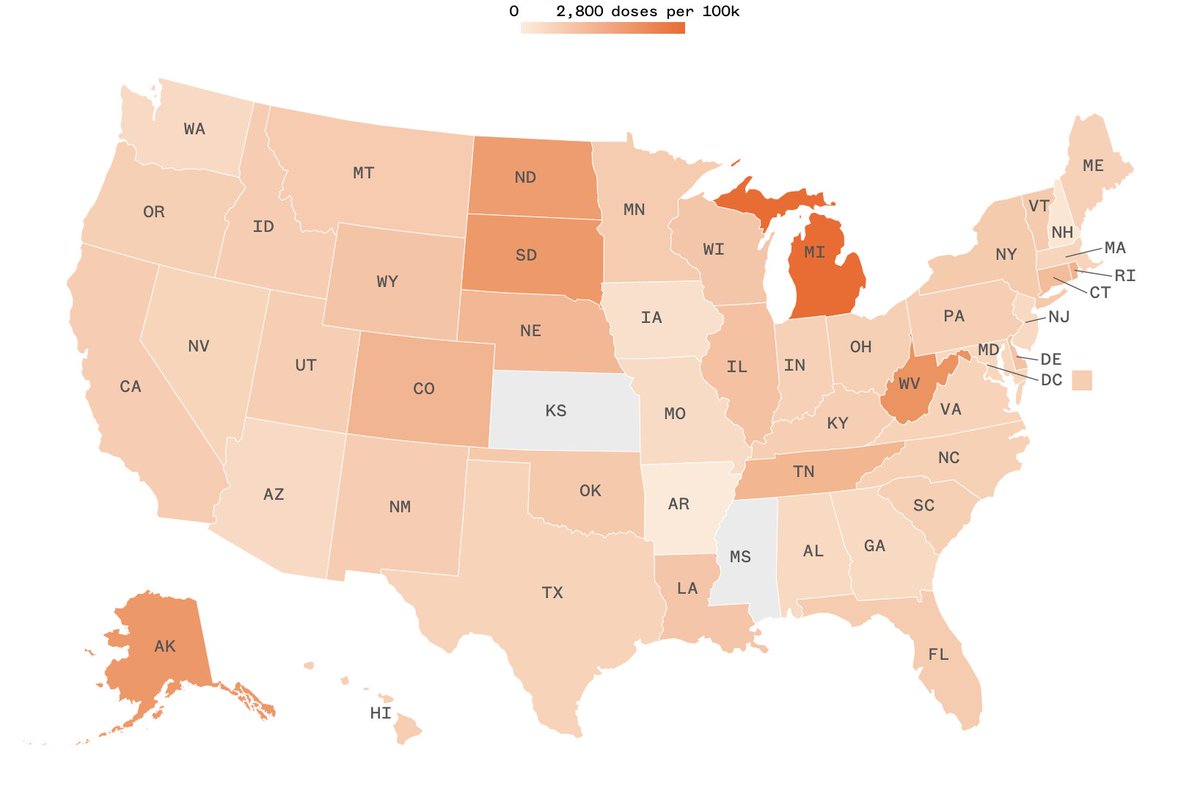
Tonight's #VaccinateAmerica dashboard update: 28 jurisdictions have vaccine dashboards with a total of 966,990 doses administered. This is an increase of 122,013 from yesterday. Keep in mind that states do back-report, especially with doses over Christmas. public.tableau.com/views/COVID-19…
New view on the dashboard: Roll over each state on the top 2 maps to see curves new doses administered and distributed by date. For example, here are graphs for South Dakota and Florida (this view is best for states that report daily/frequently). public.tableau.com/views/COVID-19…
The CDC also updated its national counts, which you can see on the "CDC Data" tab. According to the CDC, over 2.1 million doses have been administered nationwide.
Dose allocations for the coming weeks are expected to be released by Operation Warp Speed in the coming days, and the dashboard will be updated accordingly.
The key number to watch is the national pace (doses/day). We currently do not have enough data for an accurate estimate.
• • •
Missing some Tweet in this thread? You can try to
force a refresh
Most vaccine trackers by media outlets have been focusing on one metric: what percentage of the population has been vaccinated. However, the single-most important metric for us to currently watch is what percentage of doses distributed have been administered. Thread:
In the coming weeks and months, these numbers will prove to be important — Americans will want to see what percentage of their community has been vaccinated (ideally, fully vaccinated with two doses). However, we have been not focusing our attention on our last-mile issue.
It has only been within the previous few days that the public has turned its attention to the discrepancies between distribution and administration. This great piece by @NicholasFlorko and @OliviaGoldhill clearly shows the frustration from experts. statnews.com/2020/12/29/pub…
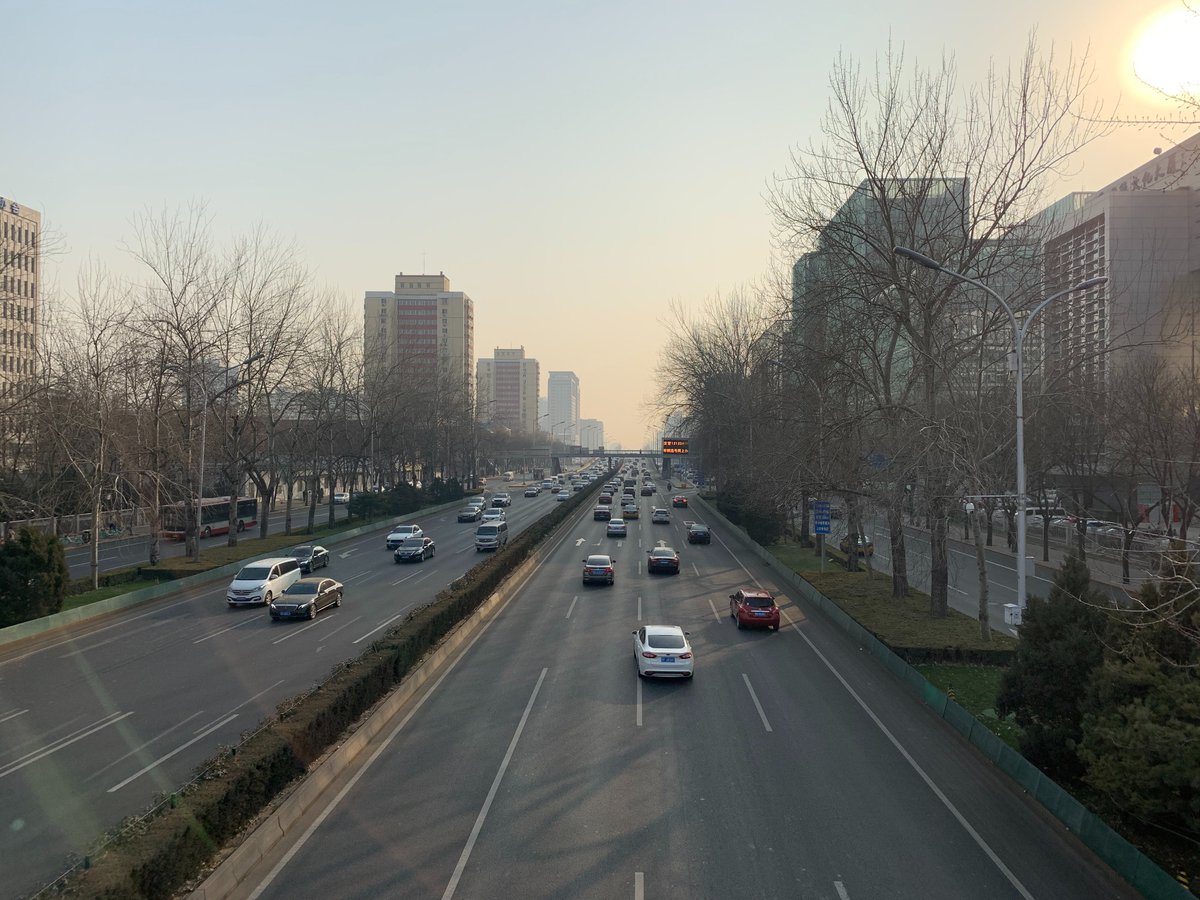
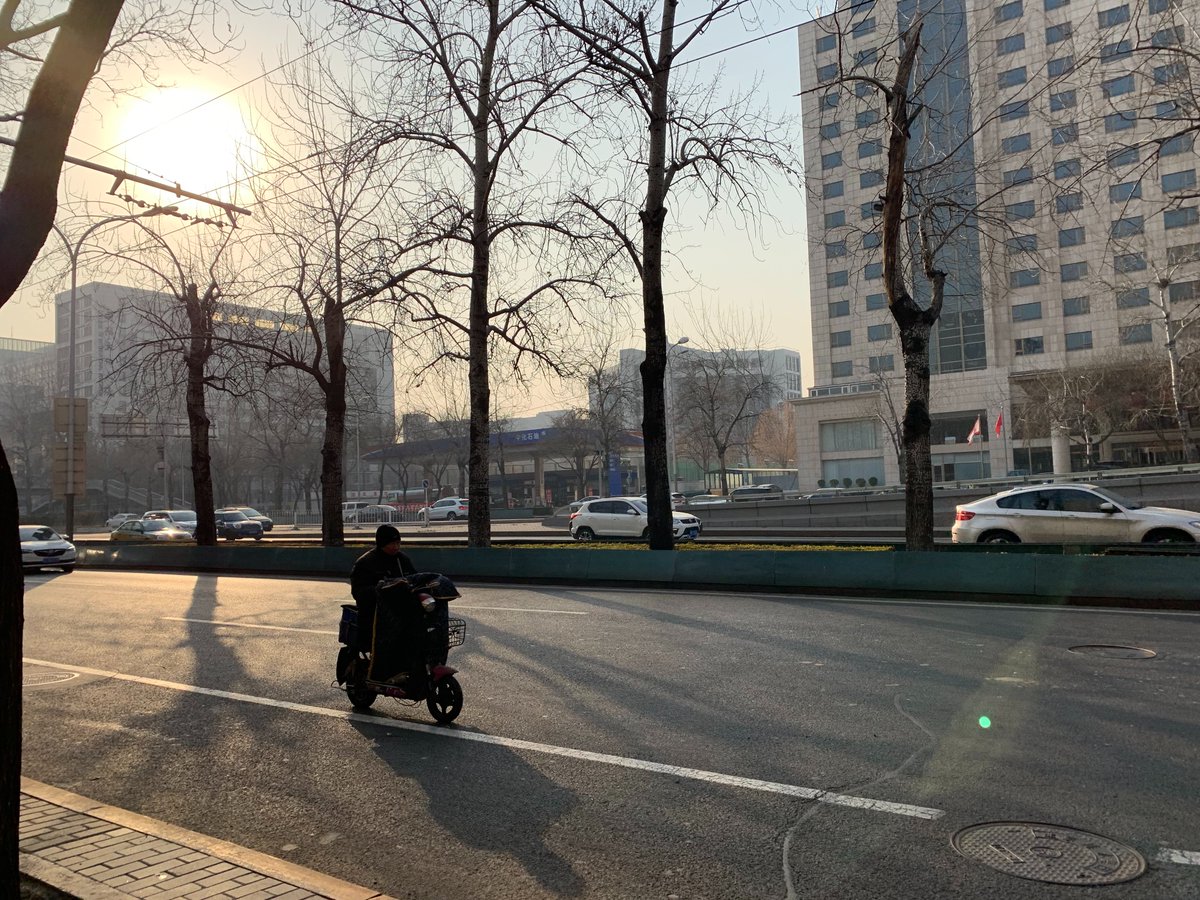
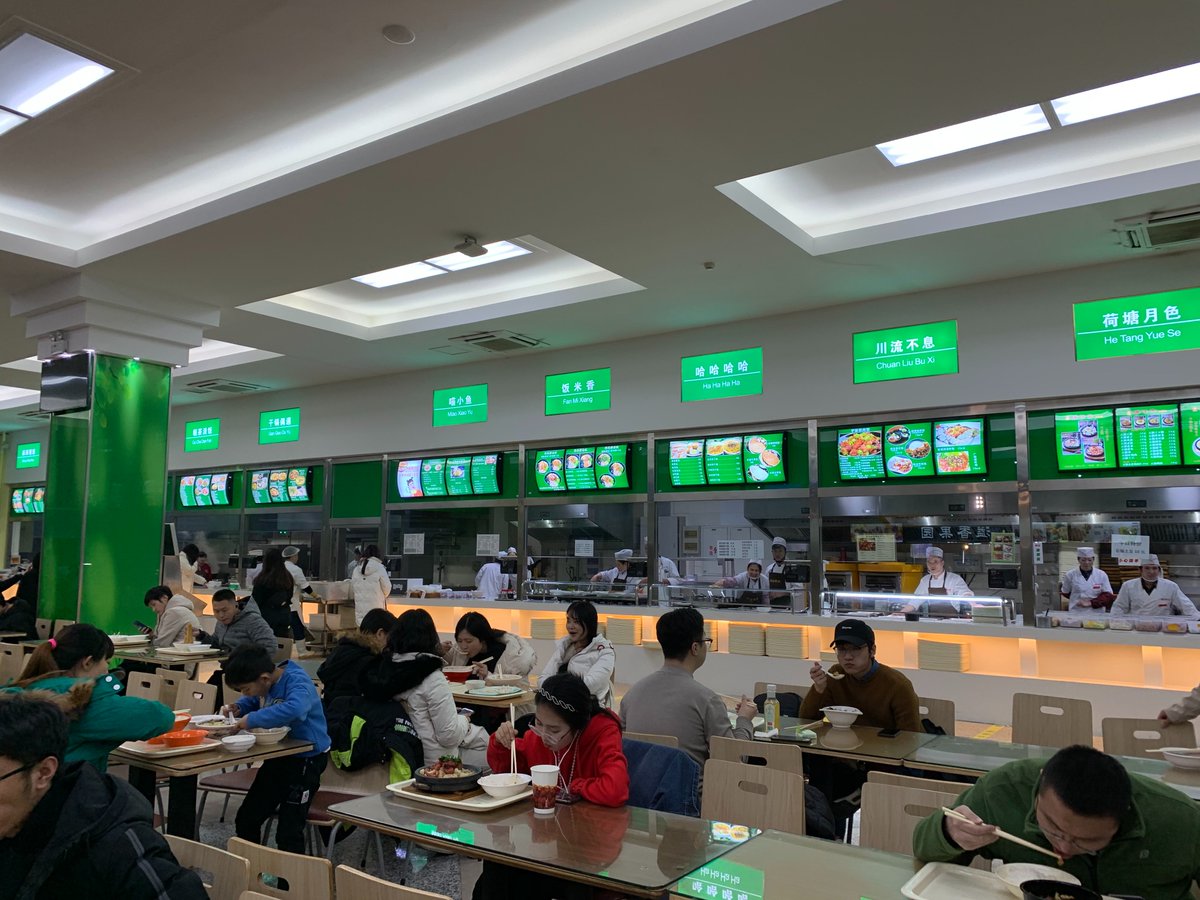
Morning of December 28, 2019: 1 year ago today, I arrived in China with a group of students on a study abroad program, which would be suspended a month later due to the coronavirus outbreak. In this thread I'll do my best to chronicle the developments as I saw them, 1 year on.
The first few weeks of the program were filled with normal classes and excursions around Beijing. It was really only until the third full week when we began becoming aware of what would turn out to be a pandemic. More updates to this thread to come around January 21, 2021.
If you can't wait until then, you can read the daily updates I posted here. Updates will be posted in local time — 13 hours ahead of ET. offthesilkroad.com/2020/01/27/wuh…
When states impose restrictions it usually takes a number of days for cases, hospitalizations and deaths to peak. But what exactly is that number? Answers from 6 other states that imposed restrictions from the summer and fall may be able to give us insights on California.
The states used in this analysis are from the thread here, where we evaluated the impacts of Michigan's epidemic order on possible case peaks. All data are taken from @COVID19Tracking and policy dates from @JuliaRaifman and team.
Let's first look at Michigan. Compared to California, it seems that Michigan imposed restrictions slightly further along the case curve than CA did (though California's order was regional). Cases peaked 12 days after the order was imposed, hospitalizations 15 and deaths 27.
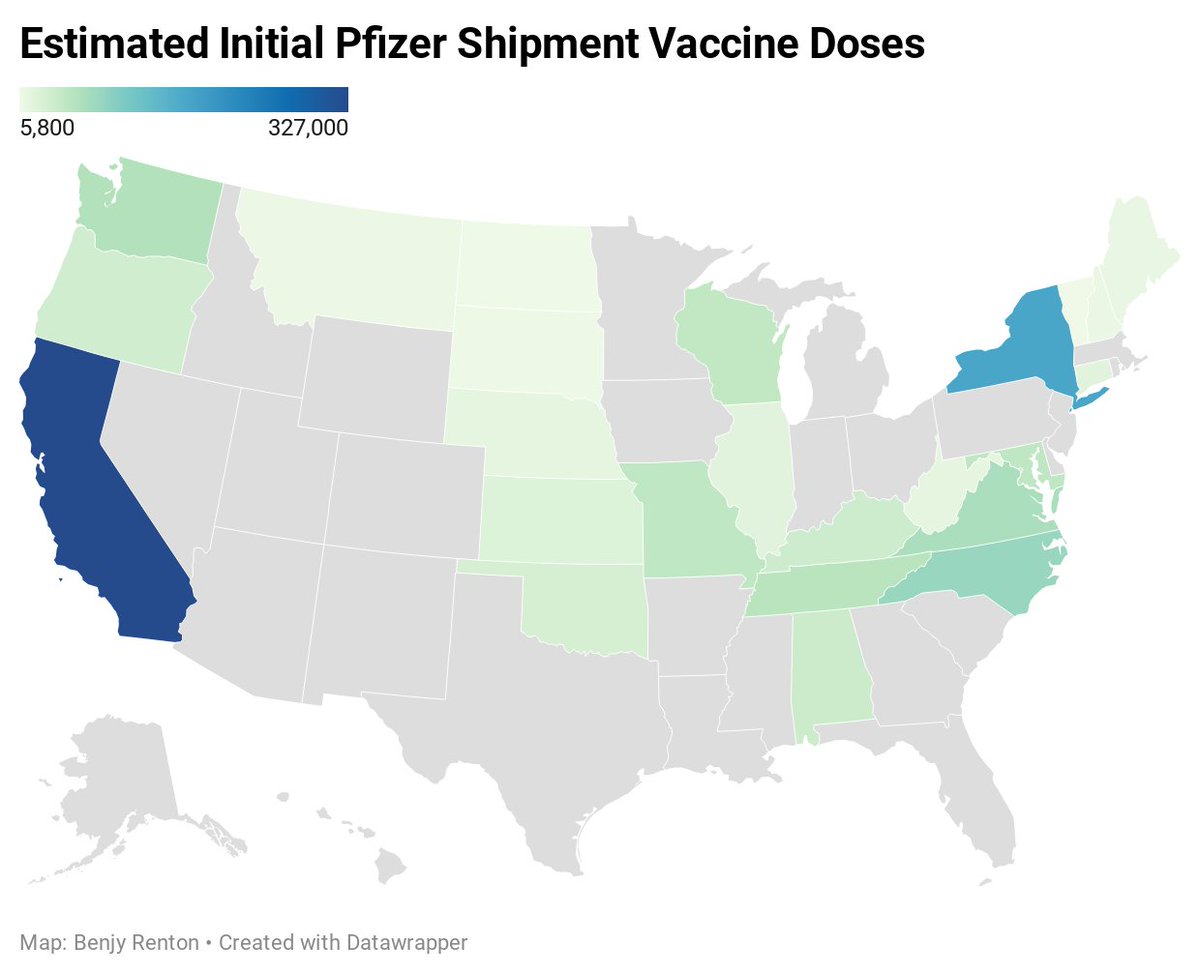
In a few weeks, Pfizer is expected to have its first shipment of vaccine doses ready for administration, pending vaccine approval. How many doses is each state allocated? I went through as many local media sites/press conferences available to find out. (thread)
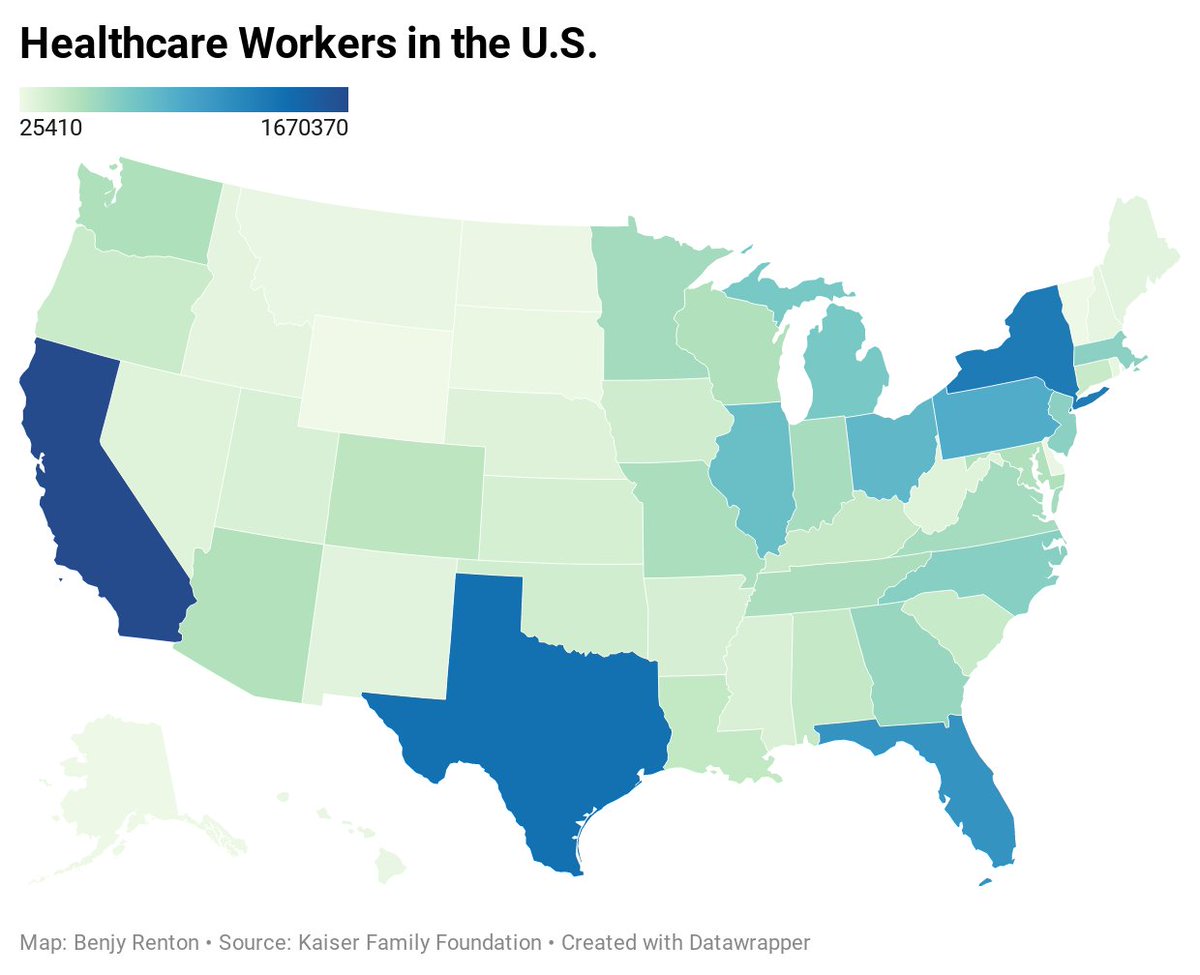
Most, if not all, states will prioritize healthcare workers in their initial vaccine distribution plans. @KFF data from 2018 show us how many healthcare workers (around 17 million nationally) are in each state.
Pfizer expects around 6.4 million doses in its first round of shipments on December 15. Moderna will then ship an initial round of vaccines. A few weeks later, according to most states, Pfizer will ship a second round of shipments for the first group's second doses, and so on.
I urge all Americans to watch @beijingloafer's gripping new film, 76 Days. The film details the resilience, compassion and dignity displayed by Wuhan's healthcare workers during the first 76 days of the lockdown, treating patients in 4 hospitals. 76daysfilm.com/watch
One particularly poignant scene was at the end, where Yang Li, the head ICU nurse at Wuhan Red Cross Hospital, calls families of the dead to return their phones and other belongings. "We really tried everything," she says as she consoles one family member. nytimes.com/2020/12/03/mov…
Yesterday, @theNASEM released a new report on best practices for testing strategies at colleges, as well as a report on encouraging protective public health behaviors on campuses. @franciediep wrote an excellent summary here. A few key points on both: chronicle.com/article/live-c…
Let's start with testing.
- Testing is one part of a comprehensive strategy
- Routine collection and analysis of data necessary
- Positive tests should be isolated in hours (modeling assumes this)
- Compliance expectations should be communicated nap.edu/download/26005
"As one webinar participant remarked, 'Testing is like electricity....You can have college without it, but you really can’t function very well.'"