AZ COVID Update: 1/3/21
Thread.
Lots of data to look at for AZ. Holiday behavior patterns both for residents (when they get tested) and gov't (when they process the results) are difficult to predict, so it's important to look closely at the details.
First, Cases.
/1
Thread.
Lots of data to look at for AZ. Holiday behavior patterns both for residents (when they get tested) and gov't (when they process the results) are difficult to predict, so it's important to look closely at the details.
First, Cases.
/1

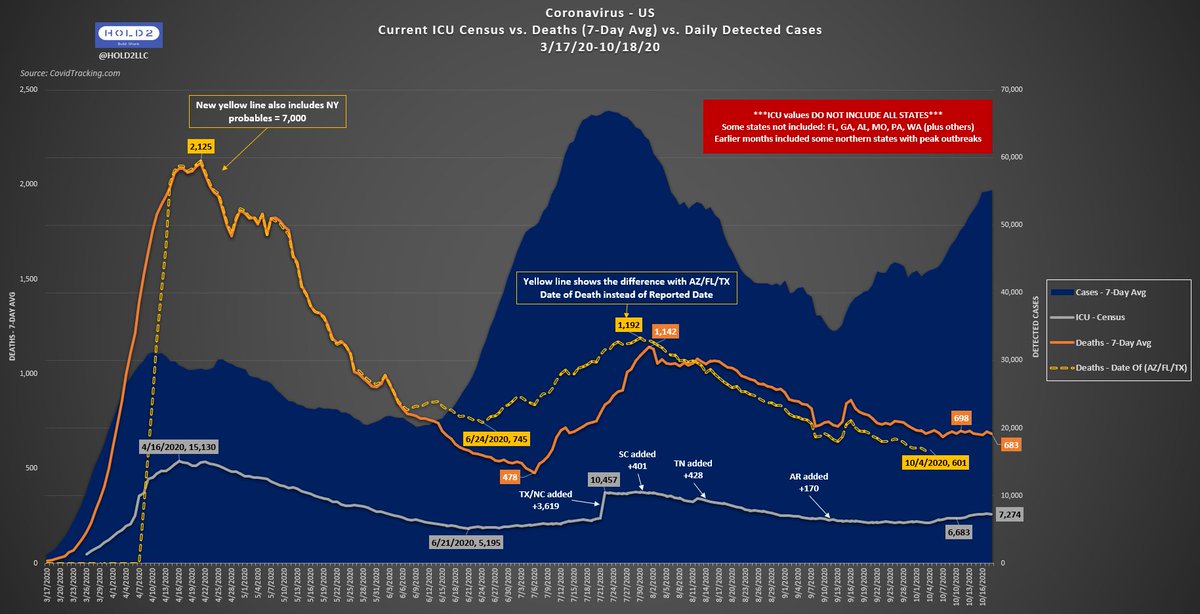
Today, 17k cases were reported, but it's important to know the difference between Report Date and Date of Specimen Collection. You see in my chart that there was a major dip in cases right when very few tests were performed on the 24th-26th despite 2 being weekdays.
/2
/2


Those who would have tested, but didn't, showed up to get tested on the 27-29th. Due to this, we see the 2 highest single case dates on 12/28-12/29, but the 7-day-avg is still lower than the 12/23 peak currently.
Just like CA with every restriction imaginable.
/3
Just like CA with every restriction imaginable.
/3


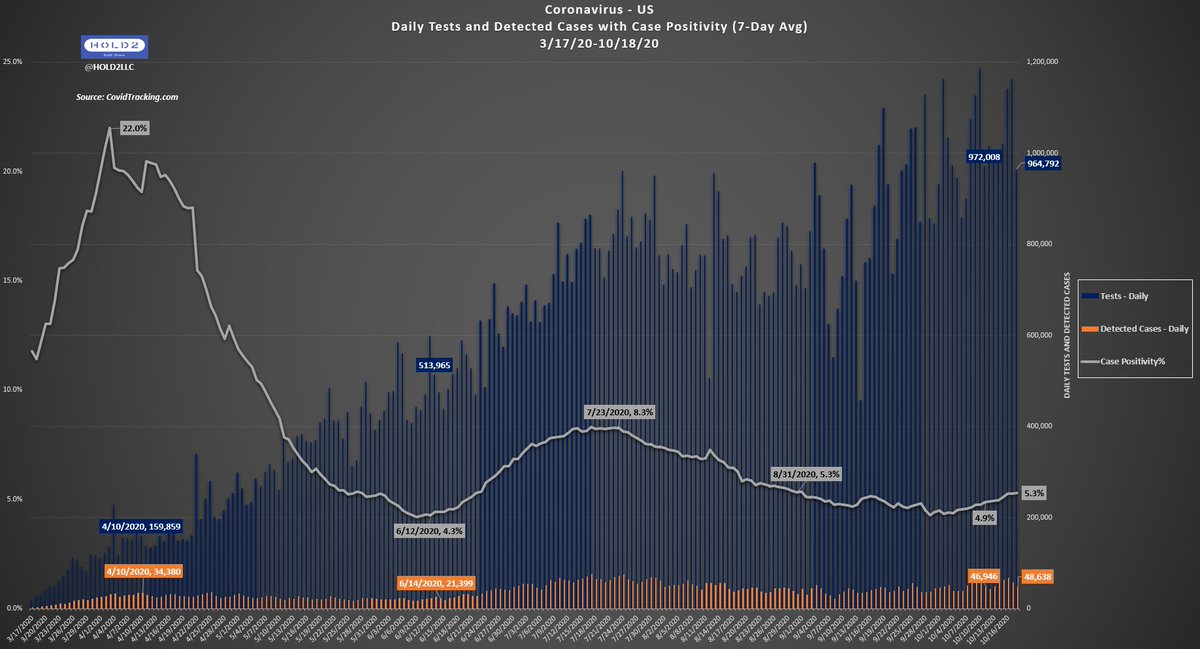
However, you see Pos% rose significantly after a 1-wk decrease. Actual positivity hasn't yet reached the July peak but is close.
This tracks with CLI as far as I see, so there is still substantial illness in the community. Notice pattern in CLI image. Ignore dropoff (lag).
/4
This tracks with CLI as far as I see, so there is still substantial illness in the community. Notice pattern in CLI image. Ignore dropoff (lag).
/4


Hospitalization data patterns are less susceptible to holiday reporting and community behavior, so let's look at those.
- COVID Inpatient usage leveled off but has happened a few times. Would need to see it continue for another week to know
- COVID ICUs mimic
/5
- COVID Inpatient usage leveled off but has happened a few times. Would need to see it continue for another week to know
- COVID ICUs mimic
/5


Deaths look the same but always lag heavily in terms of seeing the full picture. With high #s on Vents, I don't expect this to peak for a while. Growth has slowed significantly since early December but DCMs are always a wildcard.
/6
/6

Overall, AZ has been at a relative case plateau since around Thanksgiving but is not yet falling. Until CLI starts to fall, I don't expect the rest of the metrics to drop.
/END
/END
• • •
Missing some Tweet in this thread? You can try to
force a refresh