1/ Starting last week I began unpacking all the data related to the content battlefield in the #streamingwars in 2020. This meant everything from Netflix datecdotes to Nielsen data to Google trends to countless other analytics firms.
2/ The plan is to release the results (the articles) in a few of my favorite outlets (@decider, @whatonnetflix, my site). But in the meantime, I thought I’d share some thoughts on each analytics firms results and what they can tell us.
3/ BTW, I've been so deep into the data, I'm a bit punchy. So pardons if I get too snarky or too sarcastic or the jokes don't land.
4/ Let’s start with @nielsen who announced at CES today a new TVOD measurement system.
(Good for them by the way!)
(Good for them by the way!)
5/ To show my cards, Nielsen provided me this report and has provided me data in the past that isn’t publicly available.
So I could be biased, but unlike other biased sources who don't tell you, I do.
So I could be biased, but unlike other biased sources who don't tell you, I do.
7/ Here are the headline TV tables: 

8/ And the film tables:

9/ So three top ten lists. Let’s define what the data is actually measuring here. From what I can tell/have confirmed this is:
What - Total minutes viewed
Who - US subscribers
What - All streaming TV
When - During all of 2020
Where - America only
How - Nielsen’s panel
What - Total minutes viewed
Who - US subscribers
What - All streaming TV
When - During all of 2020
Where - America only
How - Nielsen’s panel
10/ This step is key. Because if folks want to criticize a data source, they first need to explain what it is.
Really, my goal is to explain the limitations and benefits for every data source. Different metrics tell different stories. So understanding the metric is key.
Really, my goal is to explain the limitations and benefits for every data source. Different metrics tell different stories. So understanding the metric is key.
11/ The key to focus on here is the change in the “when” compared to other metrics. And we’ll see this in a few year-end lists. In this case, by expanding to an entire year, it could bias against films/shows released at the end of the year.
12/ Also, the total minutes viewed metric biases towards shows with multiple seasons on the air, because they have multiple seasons to catch up. That’s clearly the case with this look. (So this won’t show us what was the most watched new show.)
13/ With that said, let’s dig for insights. First off, it appears as if on the TV side, Netflix has mostly been able to spread out the quality content throughout the year.
That said, Q2 didn't have any content make the list, as the end of Q1 had a few dominant shows:
That said, Q2 didn't have any content make the list, as the end of Q1 had a few dominant shows:

14/ Onto my other hobby horse: Ownership.
Frankly, when you look at 2020 as a whole, it's amazing how little Netflix owns of its most popular content. And that includes originals. Really, it's Ozark and Tiger King (both Q1 shows) and that's it.
Frankly, when you look at 2020 as a whole, it's amazing how little Netflix owns of its most popular content. And that includes originals. Really, it's Ozark and Tiger King (both Q1 shows) and that's it.
15/ Would add, in the US, Ozark is an underrated show. It had nearly twice as many total hours viewed as any other show. And even if you account for the number of episodes, only Tiger King beats it.
16/ So what does this all mean for the competitive context? Well, Netflix owns 95% of the top ten in TV time.
That's frankly huge.
That's frankly huge.
17/ BUT! and this is the but Disney/HBO Max/Peacock are banking on, Mandalorian made it on this list.
The key question for 2021 is how does this change? Do two non-netflix shows make the list? More? If so, this race is competitive.
entertainmentstrategyguy.com/2021/01/08/is-…
The key question for 2021 is how does this change? Do two non-netflix shows make the list? More? If so, this race is competitive.
entertainmentstrategyguy.com/2021/01/08/is-…
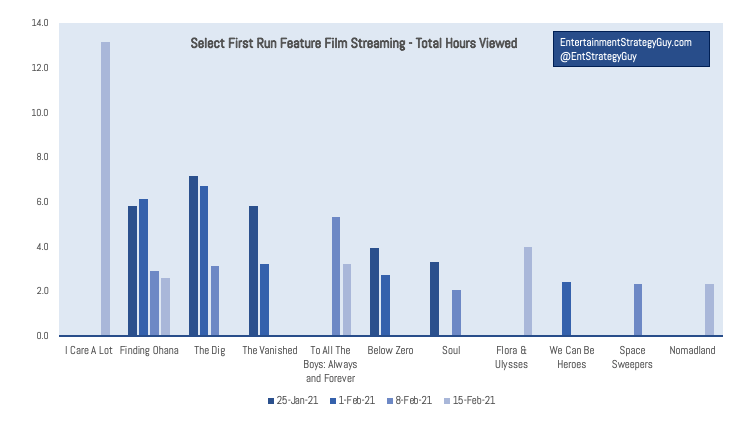
18/ This is a good segue way into movies. Holy crap is this competitive:

19/ But this is why it's important to understand how the measurements could skew this system. This includes rewatch--since it's total time measured.
In that system, kids content is king. So is it any surprise Disney+ dominates?
In that system, kids content is king. So is it any surprise Disney+ dominates?
20/ Well, actually yeah! We were told that losing Disneys' content would have no impact on Netflix.
But a year ago, if we had this list, it would be filled with Disney titles on Netflix.
Now they are Disney titles on Disney+.
But a year ago, if we had this list, it would be filled with Disney titles on Netflix.
Now they are Disney titles on Disney+.
21/ Since viewership drives usage drives retention drives subscribers, this matters! Not that it will kill Netflix--I've never said that!--but it will increase their costs to acquire and retain subscribers.
That is big in the long run.
That is big in the long run.
22/ As for specifics, I've long suspected Spenser Confidential was the biggest film in the US, but I couldn't prove it because I didn't have it's opening weekend numbers.
Also, we didn't have Hamilton's data either, and this proves it was HUGE
Also, we didn't have Hamilton's data either, and this proves it was HUGE
23/ The only other outlier that I can really see here is Longmire, which is essentially a library title that as far as I can tell did not release new episodes this year.
And yet it made this list? Again the power of the library.
And yet it made this list? Again the power of the library.
24/ One note that I forgot to add: It appears as if Netflix is owning more of their content at the end of Q4. Bridgerton. Midnight Sky. Lots of the movies. Queen's Gambit.
Some glaring licensed deals (The Crown/GBBO) but they are improving.
Some glaring licensed deals (The Crown/GBBO) but they are improving.
25/ Let's defend Nielsen quickly. If your response is "this doesn't cover mobile" that DOES NOT matter.
If you've looked at streaming metrics, you know that the top shows on mobile tend to be the top shows on living room TV.
If you've looked at streaming metrics, you know that the top shows on mobile tend to be the top shows on living room TV.
26/ I mean think about it, do kids watch TV on iPads and phones?
Heck yes! If anything, the Nielsen numbers may UNDERSELL how much kids watch on mobile. This may be even more Disney skewed.
Heck yes! If anything, the Nielsen numbers may UNDERSELL how much kids watch on mobile. This may be even more Disney skewed.
27/ So no, it doesn't bother me at all.
28/ Also, if you read me yesterday, you'll know that I've found out that Nielsen is TOTALLY correlated with Netflix released datecdotes.
Perfectly correlated? Gosh no. That'd be crazy. But correlated enough that you can 100% use it to forecast!
Perfectly correlated? Gosh no. That'd be crazy. But correlated enough that you can 100% use it to forecast!
https://twitter.com/EntStrategyGuy/status/1348775400004935683
• • •
Missing some Tweet in this thread? You can try to
force a refresh