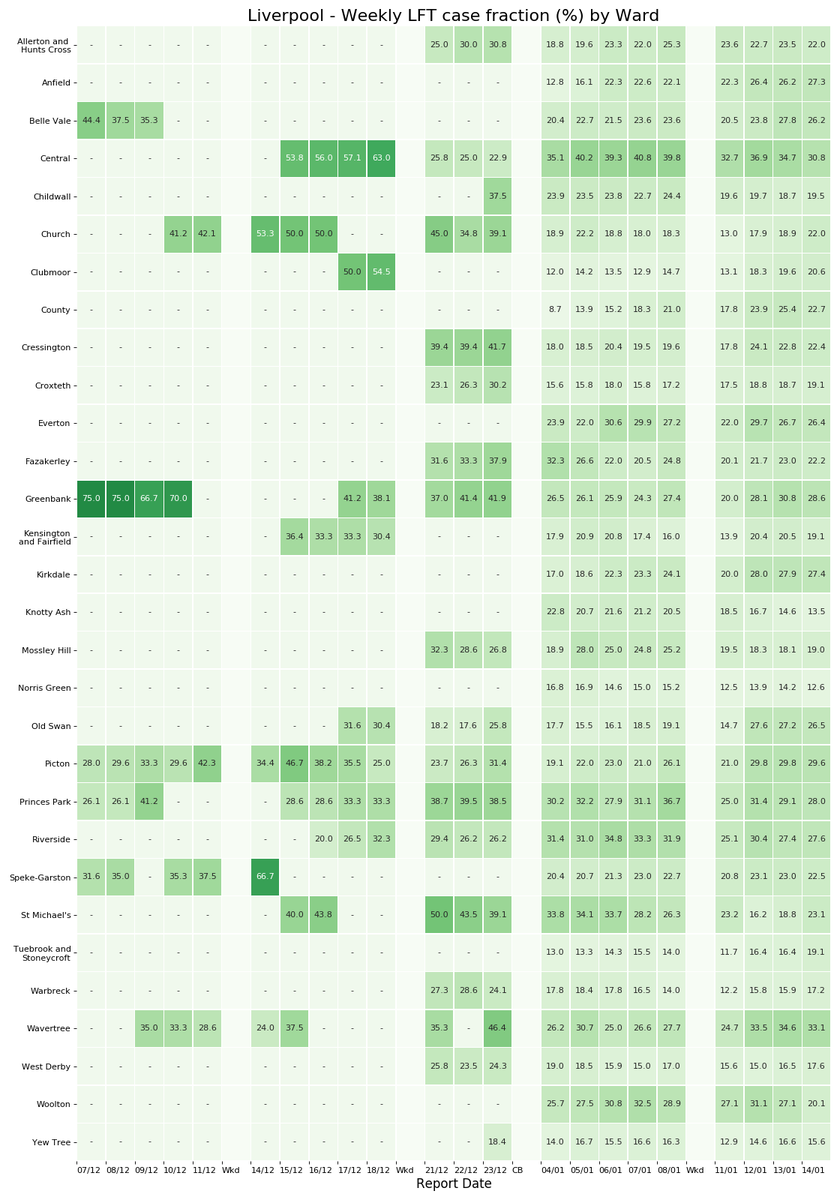
Liverpool #COVID19 Community Testing: 13th Jan 2021 update
The pilot is over but Liverpool are still rolling out lateral flow tests in some form or another. Here's the weekly breakdown from 7th Dec.
CB = Christmas Break
Data: liverpool.gov.uk/communities-an… 1/5
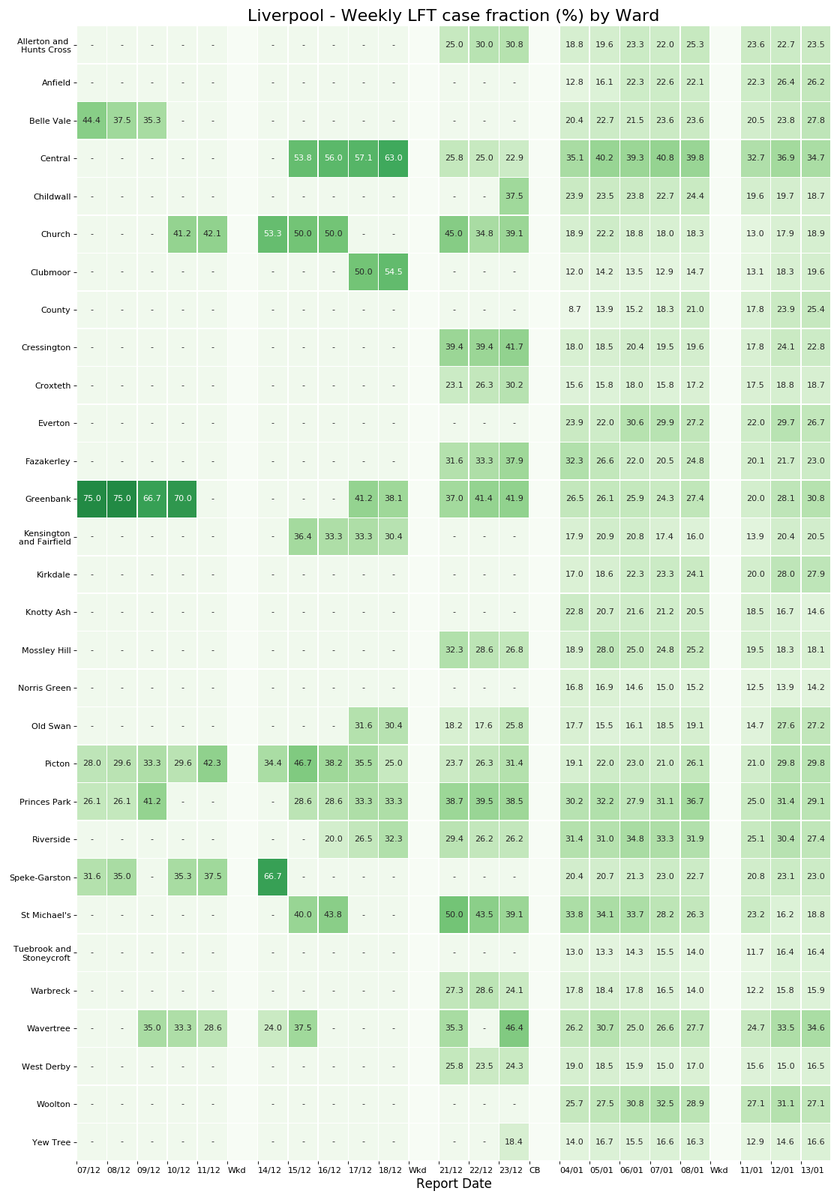
The pilot is over but Liverpool are still rolling out lateral flow tests in some form or another. Here's the weekly breakdown from 7th Dec.
CB = Christmas Break
Data: liverpool.gov.uk/communities-an… 1/5

Weekly LFT fraction of +ves, for those areas not affected by small number suppression:
No more low numbers so can see the fractions in all areas now
35% of Central Liverpool's cases were identified by asymptomatic testing last week. Mean of 23% across all areas 2/5
No more low numbers so can see the fractions in all areas now
35% of Central Liverpool's cases were identified by asymptomatic testing last week. Mean of 23% across all areas 2/5
After Liverpool was placed in Tier 2 following the 2nd National Lockdown cases started to edge up. Though, the jump in the week following Christmas towered over this..
However, currently there are small signs cases could be starting to decrease. Still high but we'll see!🤞
3/5
However, currently there are small signs cases could be starting to decrease. Still high but we'll see!🤞
3/5

Most recent weekly positivity of both PCR and Lateral flow still rising compared to week prior, but the increase is now showing some signs of this growth slowing.
Data: coronavirus.data.gov.uk
4/5
Data: coronavirus.data.gov.uk
4/5

If we histogram the proportion of daily cases found by asymptomatic lateral flow testing since the initiative begin on 6th November, we get a mean at around 30%.
Last reported date (10th Jan) was 29.7%
5/5
Last reported date (10th Jan) was 29.7%
5/5

• • •
Missing some Tweet in this thread? You can try to
force a refresh