Weekly update on the #COVID19 situation in Liverpool: 15th Jan 2021
- Weekly cases possibly peak on 8th Jan at 5,419.
- Both under & over 60's rate starting to fall. 🙂
- BUT, Liverpool hospitals admissions have increased sharply, passing highest levels from 2nd wave 😩
1/19
- Weekly cases possibly peak on 8th Jan at 5,419.
- Both under & over 60's rate starting to fall. 🙂
- BUT, Liverpool hospitals admissions have increased sharply, passing highest levels from 2nd wave 😩
1/19

Total weekly cases were seen to grow >3x that of previous week at end of year but weekly growth has now declined & cases are now falling.
The peak occurred 8th Jan but more importantly cases are still higher than in 2nd wave, so restrictions still necessary. 2/19
The peak occurred 8th Jan but more importantly cases are still higher than in 2nd wave, so restrictions still necessary. 2/19

Scary rates were seen for both under & over 60 age groups at end of year but both have started to show signs of discontinued growth.
Still, rates in > 60's are very high and unfortunately lots more people will require hospital treatment. 3/19
Still, rates in > 60's are very high and unfortunately lots more people will require hospital treatment. 3/19

In fact, in the last reported data up to 10th Jan admissions to Liverpool University hospitals NHS FT shot up from a 7-day average of 10 a day in mid-December to a frightening 73 people on 9th Jan.
As of 10th Jan there were 345 people in hospital and 27 on MV beds. 4/19
As of 10th Jan there were 345 people in hospital and 27 on MV beds. 4/19

Pause.
On 12th Dec, 112 people (already a high number) were in hospital with this one disease. In less than a month this more than *tripled*.
And, as of recent data, is getting higher. 5/19
On 12th Dec, 112 people (already a high number) were in hospital with this one disease. In less than a month this more than *tripled*.
And, as of recent data, is getting higher. 5/19
According to Gov & ONS figures, there have been 4,490 total admissions in Liverpool and 746 hospital deaths.
In other words, for every 20 people who walked into hospital 3 didn't walk out.
Death isn't just a problem for people in care homes. 6/19
In other words, for every 20 people who walked into hospital 3 didn't walk out.
Death isn't just a problem for people in care homes. 6/19
Below is something cooked up quick but there's a point.
Cases lag hospital admissions.
Orange bars = weekly case rate in over 60's. Black = weekly hospital admissions shifted 5 days.
Although cases may have 'peaked', reported hospital admissions will continue to go up. 7/19
Cases lag hospital admissions.
Orange bars = weekly case rate in over 60's. Black = weekly hospital admissions shifted 5 days.
Although cases may have 'peaked', reported hospital admissions will continue to go up. 7/19

And the situation is already critical.
Here's a great report which puts into context what these numbers *actually* mean to those on the front-line.
8/19
Here's a great report which puts into context what these numbers *actually* mean to those on the front-line.
8/19
https://twitter.com/LiamThorpECHO/status/1349670627448381440?s=20
Liverpool suffered a very bad 2nd wave with a fifth more people dying than expected in a normal year, driven by COVID-19 deaths.
Week ending 1st Jan there were 19 reported deaths, with 16 occurring in hospital. Subject to get higher due to bank holiday reporting lag. 9/19
Week ending 1st Jan there were 19 reported deaths, with 16 occurring in hospital. Subject to get higher due to bank holiday reporting lag. 9/19

Since 6th Nov, Liverpool have rolled out rapid asymptomatic lateral flow (LF) testing as well as symptomatic PCR tests.
In week ending 12th Jan there were 4,580 cases. Including 1,006 individuals (22%) identified by asymptomatic LF testing. 10/19
liverpool.gov.uk/communities-an…
In week ending 12th Jan there were 4,580 cases. Including 1,006 individuals (22%) identified by asymptomatic LF testing. 10/19
liverpool.gov.uk/communities-an…

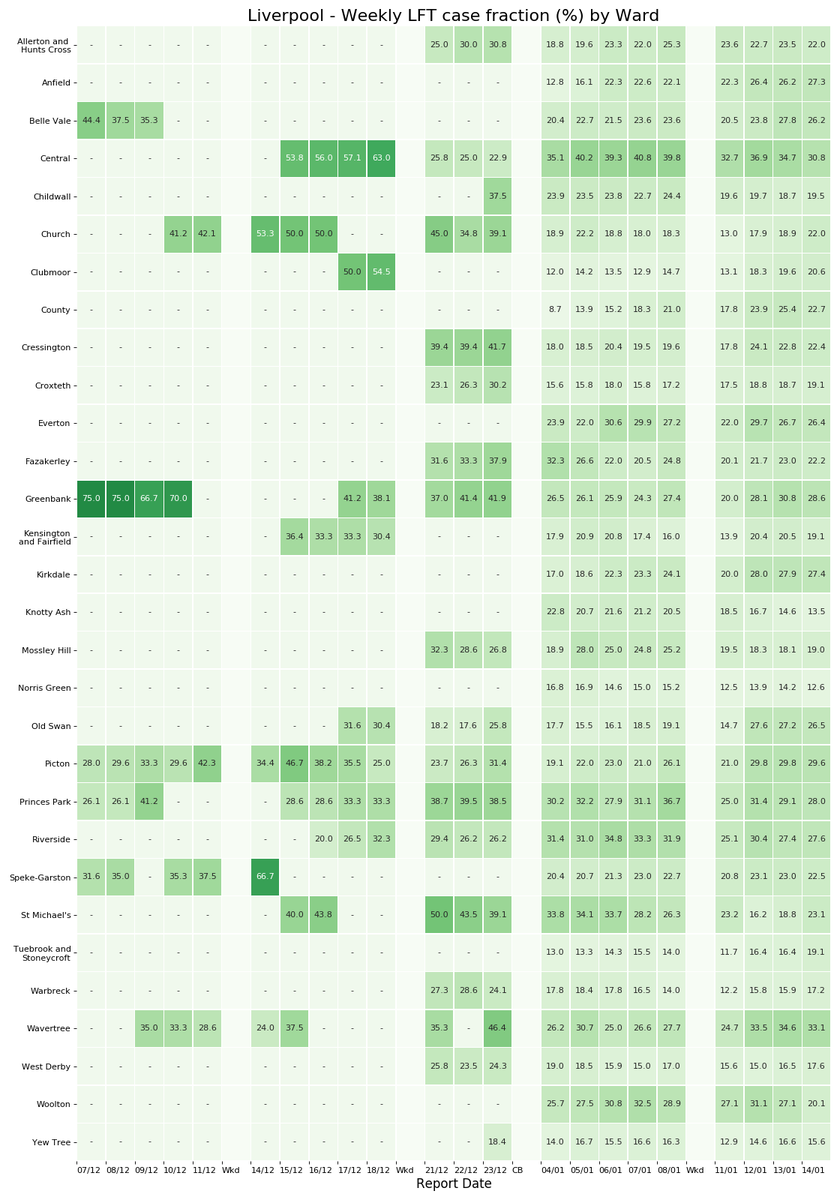
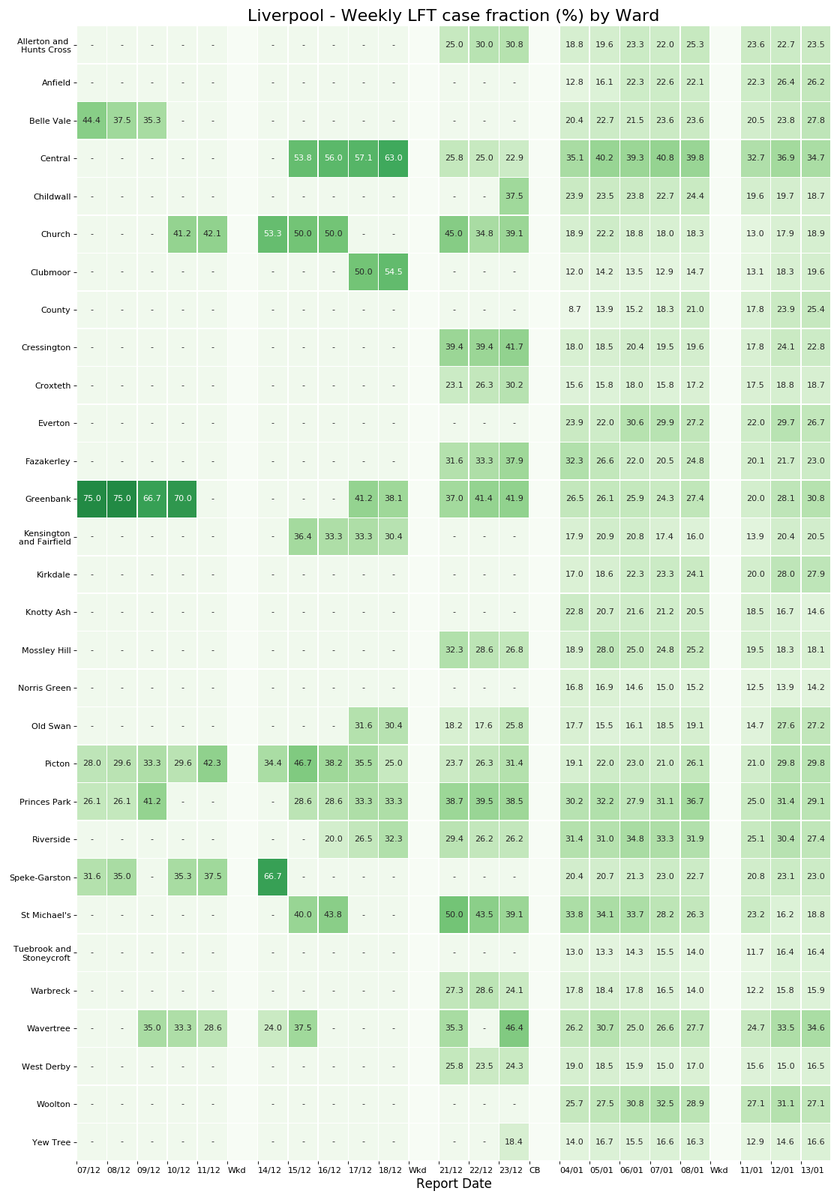
A heat-map of the weekly breakdown of Liverpool cases by ward, split by type of test, can be found below:
11/19
11/19
https://twitter.com/AdamJRuby/status/1349871012716941314?s=20
Below is a summary of rolling weekly testing numbers and corresponding positivity for LF & PCR, since the community testing began.
PCR & LF testing positivity is high at approx 20% and 3% respectively but has recently stopped growing
12/19
PCR & LF testing positivity is high at approx 20% and 3% respectively but has recently stopped growing
12/19

If we zoom out, weekly symptomatic PCR positivity surpassed the highest point in the second wave.
13/19
13/19

Most cases in Liverpool now correspond to the new variant of concern.
The proportion of samples cases with spike gene target failure (SGTF, new variant proxy) increased from 2% in the latter half of November to 55% at the start of 2021.
14/19
The proportion of samples cases with spike gene target failure (SGTF, new variant proxy) increased from 2% in the latter half of November to 55% at the start of 2021.
14/19
https://twitter.com/AdamJRuby/status/1350095082234511367?s=20
According to Apple routing data, Liverpool's recent driving levels (red) have dropped -35% compared to mid-Jan 2020 and recently flattened. This is above England average.
Public transport also flat at -50%.
15/19
Public transport also flat at -50%.
15/19

Zooming out, one can see that current driving levels in Liverpool are still relatively greater now than seen during the first national lockdown, according to this metric.
16/19
16/19

Sources
Case/Hospital data:
GOV ( coronavirus.data.gov.uk )
Liverpool city council: liverpool.gov.uk/communities-an…
Deaths data: ons.gov.uk/peoplepopulati…
Apple mobility trends: covid19.apple.com/mobility
16/19
Case/Hospital data:
GOV ( coronavirus.data.gov.uk )
Liverpool city council: liverpool.gov.uk/communities-an…
Deaths data: ons.gov.uk/peoplepopulati…
Apple mobility trends: covid19.apple.com/mobility
16/19
Caveats:
- Hospital data released every Thursday (up to 10th Jan)
- Only for Liverpool University Hospitals NHS Foundation Trust (other Liverpool Trusts have small numbers)
- Five year Avg deaths scaled from national proportion (ONS definition)
17/19
- Hospital data released every Thursday (up to 10th Jan)
- Only for Liverpool University Hospitals NHS Foundation Trust (other Liverpool Trusts have small numbers)
- Five year Avg deaths scaled from national proportion (ONS definition)
17/19
Summary (I):
It looks like reduced mixing has paid off and cases are falling. However the current reported levels are very high and the strain on the healthcare service is nowhere near complete as more people will end up in hospital.
But...
18/19
It looks like reduced mixing has paid off and cases are falling. However the current reported levels are very high and the strain on the healthcare service is nowhere near complete as more people will end up in hospital.
But...
18/19
Summary (II):
If cases continue to fall and vaccines continue to roll-out & is successful, we may not ever see it get this bad again.
Reducing non-household contacts now is as important as ever and no doubt save lives & save the healthcare service from being overwhelmed. 19/19
If cases continue to fall and vaccines continue to roll-out & is successful, we may not ever see it get this bad again.
Reducing non-household contacts now is as important as ever and no doubt save lives & save the healthcare service from being overwhelmed. 19/19
• • •
Missing some Tweet in this thread? You can try to
force a refresh