1/ Alice’s Adventures in Factorland: Three Blunders That Plague Factor Investing (Arnott, Harvey, Kalesnik, Linnainmaa)
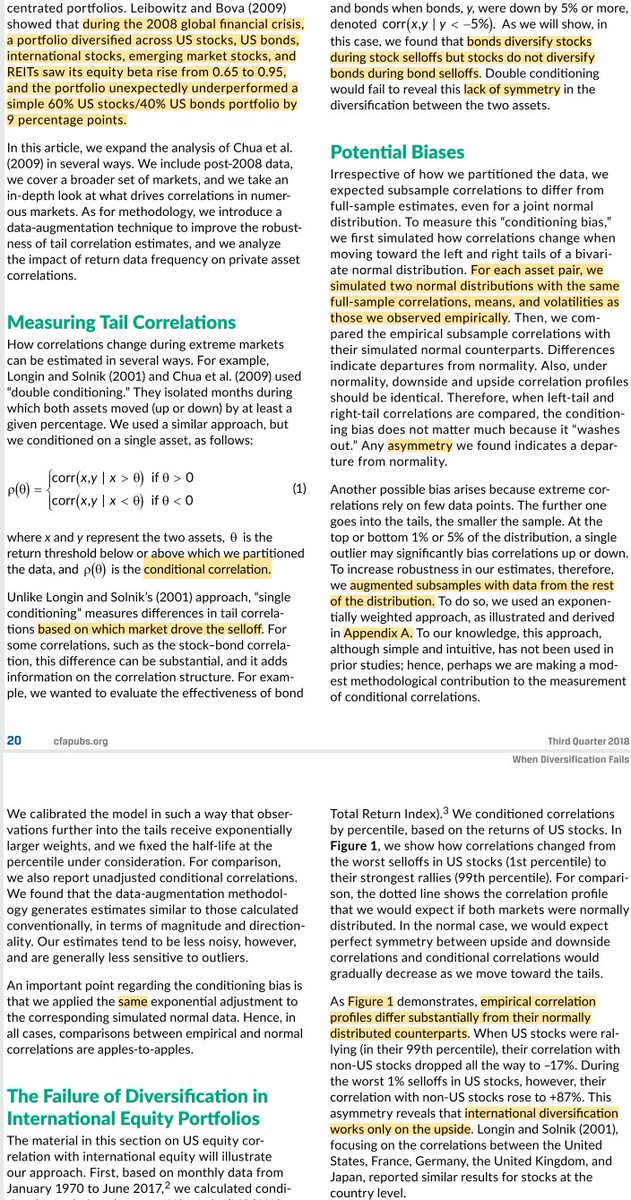
"Factor returns can experience downside shocks far larger than expected. In certain conditions, returns also become more correlated."
papers.ssrn.com/sol3/papers.cf…
"Factor returns can experience downside shocks far larger than expected. In certain conditions, returns also become more correlated."
papers.ssrn.com/sol3/papers.cf…

2/ * July 1963 to June 2018
* Factors 1-6 are the most popular academic factors, followed by factors 7-14, then the 33 factors in the "other" group
* Long/short Fama-French portfolio construction (this leads to factors being dollar-neutral rather than beta-neutral)
* Factors 1-6 are the most popular academic factors, followed by factors 7-14, then the 33 factors in the "other" group
* Long/short Fama-French portfolio construction (this leads to factors being dollar-neutral rather than beta-neutral)


3/ "When the market does great (months >1σ above the mean), most factors do not; when the market moves sideways, most factors deliver positive returns; and when the market falls >1σ, most factors are at their best. Similarly, on average, factors have higher premia in recessions."

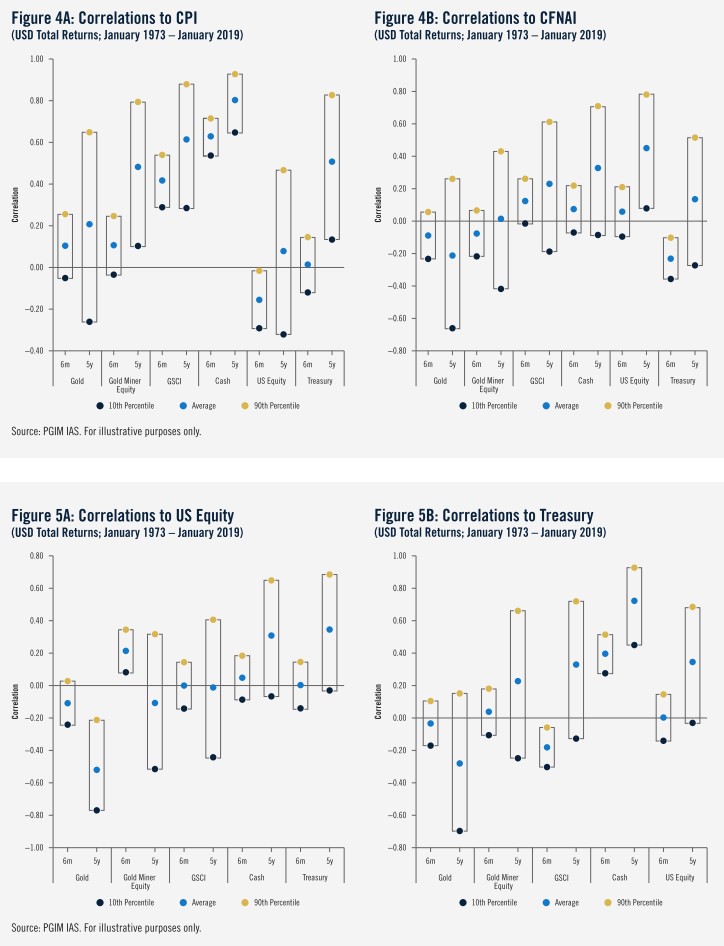
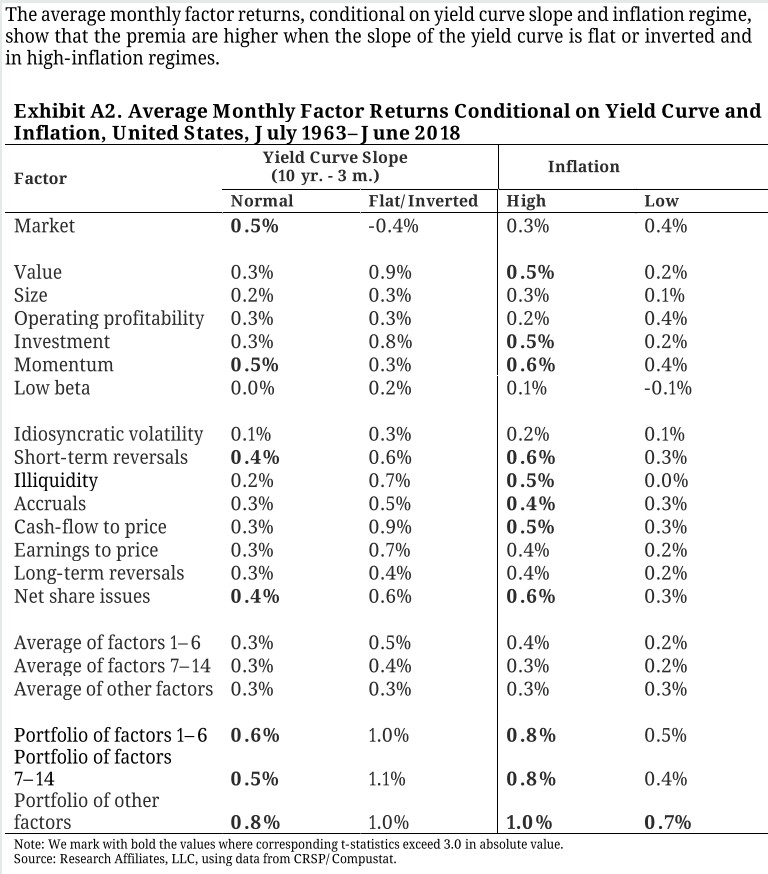
4/ "Factor premia are higher when the slope of the yield curve is flat or inverted and when inflation is high."
5/ "The amount of time-variation evident in factor betas implies that investors should probably not have great confidence in predicting the diversification benefits these factors are likely to provide in the future."

6/ "Through year-end 2018, over 400 factors have been “discovered,“ just considering those published in the top academic journals. The sheer number suggests that many are likely not true factors.
"When data are limited, the economic foundations of a factor gain importance."
"When data are limited, the economic foundations of a factor gain importance."

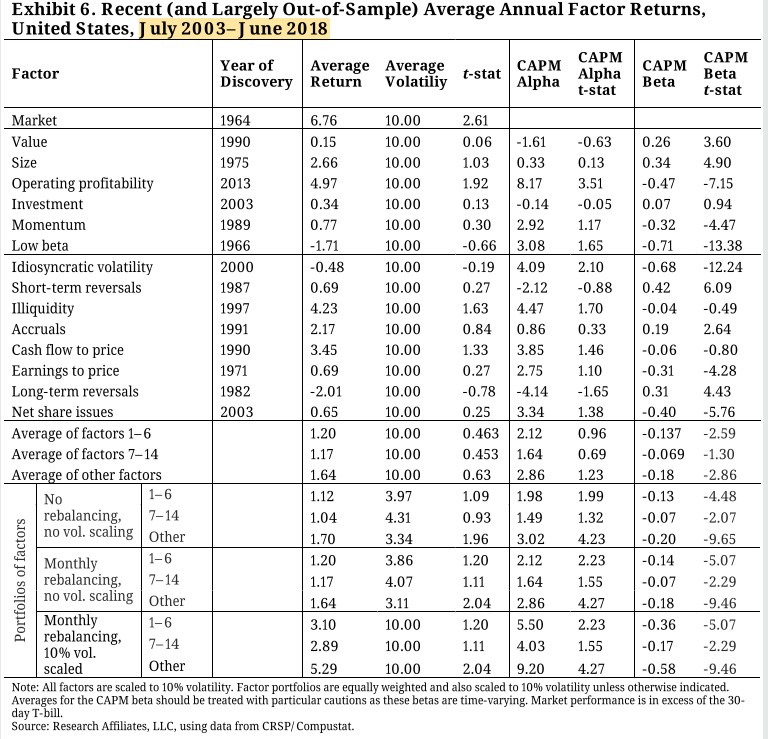
7/ "The diminishing performance of a factor after its publication is remarkable. An even more striking fact, that we think has garnered far too little attention, is that factor performance in the most recent 15 years has largely vanished for the most popular factors."


8/ "The factor portfolios' returns over the past 15 years are substantially lower than the same portfolios’ average returns over the full sample period from July 1963 through June 2018: 7.38%, 7.28%, and 10.28%, respectively." (Profitability's performance is largely in-sample.)

9/ "Investors should be prepared for extreme factor drawdowns.
"(Backtested momentum exhibited even more severe crashes in the pre-war period, notably during the Great Depression.)
"Forming portfolios of factors does not mitigate large drawdowns to the extent we might expect."
"(Backtested momentum exhibited even more severe crashes in the pre-war period, notably during the Great Depression.)
"Forming portfolios of factors does not mitigate large drawdowns to the extent we might expect."


10/ "Diversification across multiple factors cannot fully eliminate the risk of large drawdowns.
"If we account for the cross-, auto-, and cross-serial correlation structures in factor returns, these large drawdowns are not that surprising."
"If we account for the cross-, auto-, and cross-serial correlation structures in factor returns, these large drawdowns are not that surprising."


11/ "We examine the role of bad luck: We measure the performance of each factor over the last 15 years ending June 2018 and use simulations to assess the likelihood of observing this level of performance, given how the factors performed before these recent years."


12/ "We use the same framework to revisit the issue of recent poor performance for *portfolios* of factors.
"Relative to the powerful returns from before mid-2003, the recent performance of these portfolios of factors over the past 15 years is unexpectedly low."
"Relative to the powerful returns from before mid-2003, the recent performance of these portfolios of factors over the past 15 years is unexpectedly low."


13/ "Just as the factors underperformed the lofty expectations investors might have had in 2003, the U.S. equity market earned twice its historical Sharpe ratio (2003-2018). By the same analysis, the probability of observing this level of performance by luck is less than 2%."

14/ Related research:
Is (Systematic) Value Investing Dead?
Global Factor Premiums
Do Factor Premia Vary Over Time?
Factor Performance 2010-2019: A Lost Decade?
Is (Systematic) Value Investing Dead?
https://twitter.com/ReformedTrader/status/1259165422412128259
Global Factor Premiums
https://twitter.com/ReformedTrader/status/1198106865315405830
Do Factor Premia Vary Over Time?
https://twitter.com/ReformedTrader/status/1183099984285073408
Factor Performance 2010-2019: A Lost Decade?
https://twitter.com/ReformedTrader/status/1245559396714729473
• • •
Missing some Tweet in this thread? You can try to
force a refresh