1/ What Happens with More Funds than Stocks? (Madhavan, Sobczyk, Ang)

"Funds differ meaningfully in terms of individual stock holdings, and we examine the factor exposures of the typical fund and the cross section of holdings of different funds."

papers.ssrn.com/sol3/papers.cf…
2/ * Data on fund holdings are from Morningstar
* Sample: Jan. 1, 2007 to Dec. 31, 2018
* Only funds with at least 80% of holdings from the Russell 3000 universe are considered
* Mean AUM-weighted expense ratio for mutual funds (ETFs) is 70 bps (14.2 bps) as of Q4 2018
3/ "The holdings of ETFs and active mutual funds across U.S. stocks can be efficiently summarized by approximately 10 canonical funds.

"There is more commonality explained by the first few canonical funds for active mutual funds than for ETFs."
4/ "Commonality among equity mutual funds has remained approximately constant, but there has been increased dispersion in ETF offerings.

"We see no apparent rise in concentration or crowding for mutual funds over the period from January 2007 to December 2018."
5/ "We examine commonality in active mutual funds in Morningstar style box categories. While Value and Blend commonality has remained roughly constant over the period 2007-2018, Growth funds have exhibited a marked increase in crowded positions."
6/ "Crowding is greater in factors than in individual stocks for both active mutual funds and ETFs. Factor crowding has remained relatively constant over the period examined."
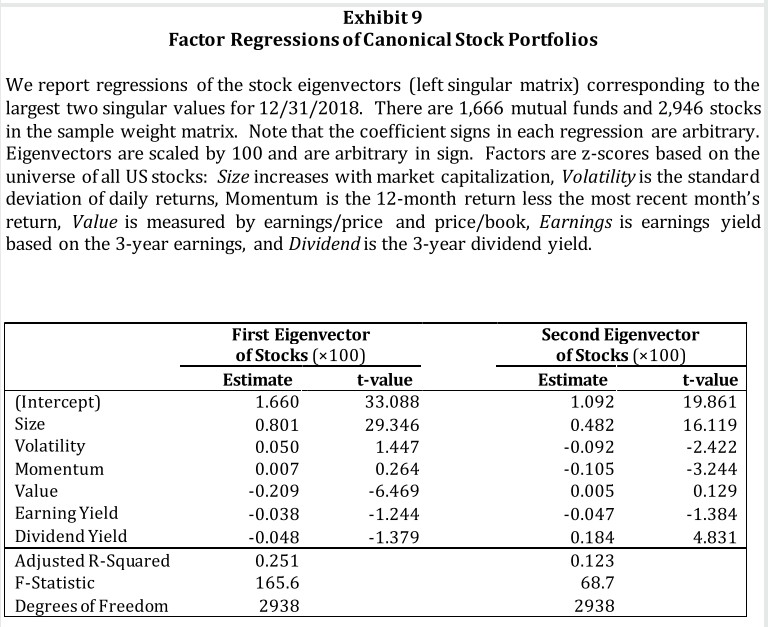
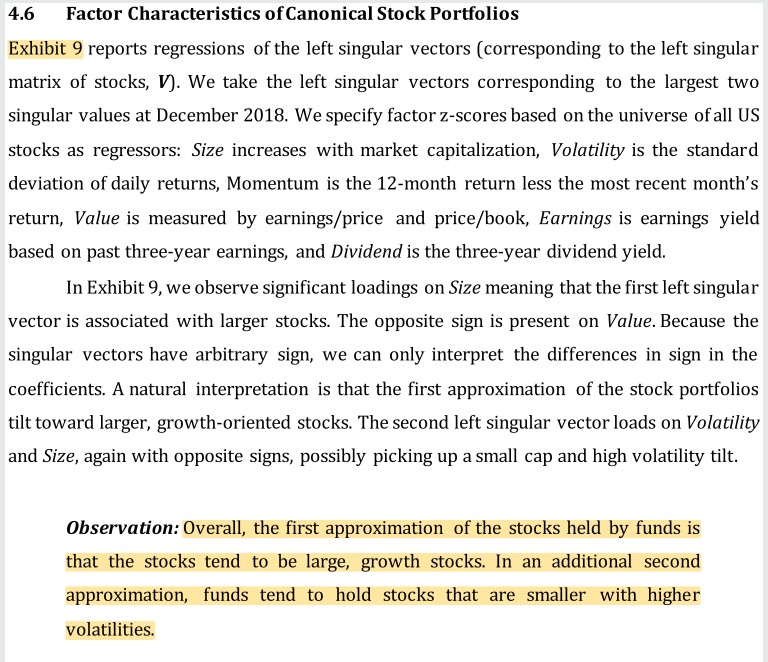
7/ "The first archetypal “fund” that approximates the whole active fund universe is a market-cap index.

"The second most important is value-growth exposure.

"For ETFs, unlike active funds, the second degree of differentiation reflects both value-growth and sector exposures."
8/ "Overall, the first approximation of the stocks held by funds is that the stocks tend to be large growth stocks. In an additional second approximation, funds tend to hold stocks that are smaller with higher volatilities."
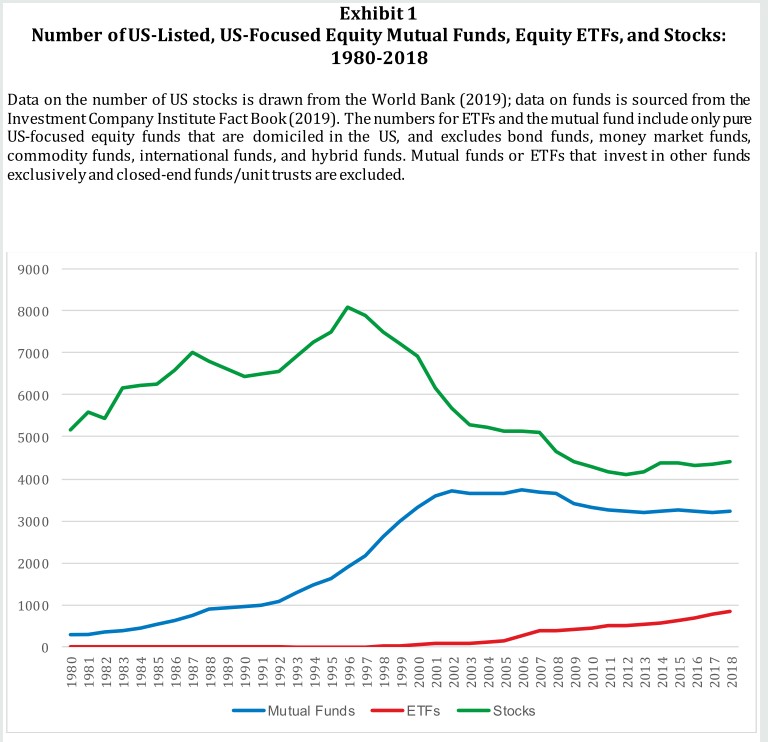
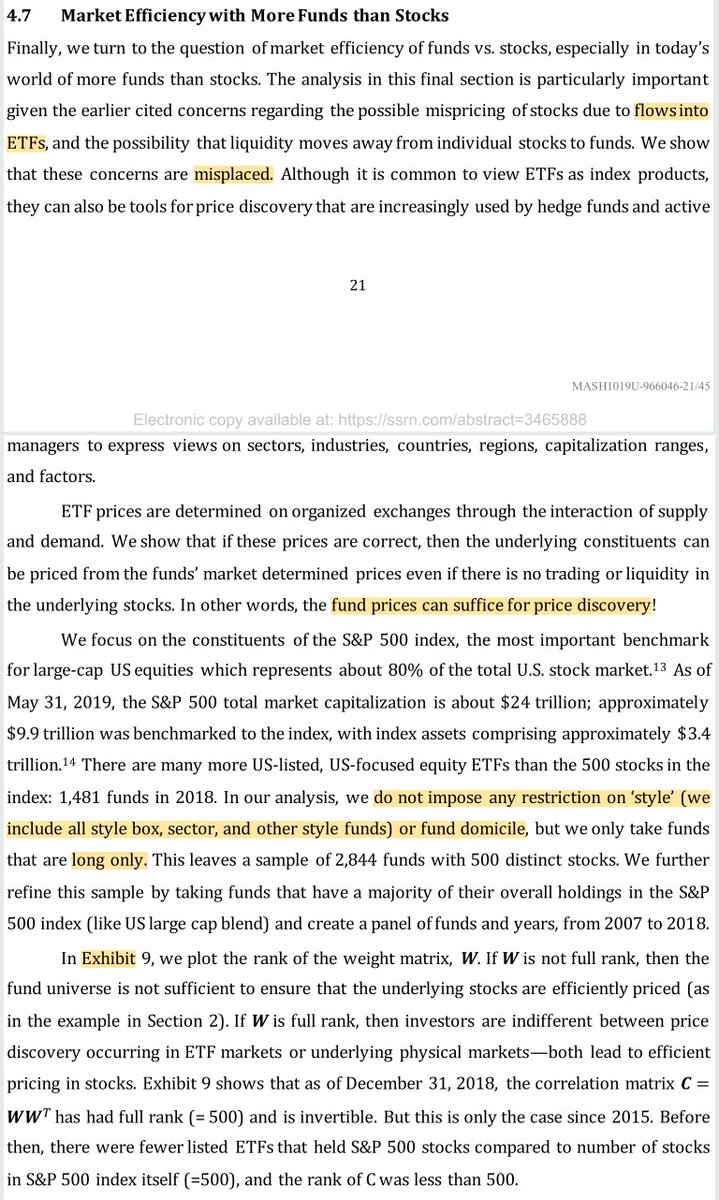
9/ "Price discovery of underlying stocks in the S&P 500 can occur through ETFs or through trades of the stocks themselves—but this has only been the case since 2015. Before then, there were fewer listed ETFs that held S&P 500 stocks compared to number of stocks in index itself."

• • •

Missing some Tweet in this thread? You can try to force a refresh
 

Keep Current with Darren 🥚

Darren 🥚 Profile picture

Stay in touch and get notified when new unrolls are available from this author!

Read all threads

This Thread may be Removed Anytime!

PDF

Twitter may remove this content at anytime! Save it as PDF for later use!

Try unrolling a thread yourself!

how to unroll video
  1. Follow @ThreadReaderApp to mention us!

  2. From a Twitter thread mention us with a keyword "unroll"
@threadreaderapp unroll

Practice here first or read more on our help page!

More from @ReformedTrader

12 Jan
1/ Research group meetings: Pros and cons

These are the ones where a paper/book/project is openly discussed and criticized.

Their dynamic is present in very few places (scientific research, theological debate, close friendships). IMO, most organizations have no idea it exists.
2/ Pro: They are great if you avoid groupthink. Always have someone other than the boss present so that dissent doesn't become associated with career risk.

Pro: This setting flattens organizations. If you have an idea, speak up: don't bother raising your hand.
3/ Pro: A good boss loves getting criticized here. If you get in a friendly argument with him in a safe setting and win, you've shown you can add something to the organizations' research efforts.

Pro: It's hard for people to get away with fudging ideas. Always present evidence!
Read 9 tweets
12 Jan
1/ When Diversification Fails (Page, Panariello)

"To fully appreciate extreme correlations, we take an in-depth look at stock-to-credit, stock-to–hedge fund, stock-to-private asset, stock-to-factor, and stock-to-bond correlations during tail events."

troweprice.com/content/dam/id…
2/ "For each pair, we simulated two normal distributions using empirical full-sample correlations, means, & volatilities."

"Empirical correlation profiles differ substantially from their normally-distributed counterparts: International diversification works only on the upside."
3/ "We found similar results across risk assets.

"We use bond returns net of duration-matched U.S. Treasuries ('excess returns') to isolate credit risk factors.

"Across the board, left-tail correlations are much higher than right-tail correlations."
Read 13 tweets
10 Jan
1/ Institutional Gold (Parikh)

"Gold’s correlations are sensitive to the investor’s horizon and time period. We discuss the difficulties of estimating correlations (especially for long horizons) and the importance of measuring estimation uncertainty."

papers.ssrn.com/sol3/papers.cf…
2/ * Futures include cash returns
* Rolls to contract with the most favorable carry or (if carry is negative) to a simulated gold ETF with 40 bps/y expenses
* Using this roll strategy has 7.1%/year returns vs. 4.8% for rolling monthly

More on this here:
3/ "Gold might serve as a long-term hedge against economic slowdowns, was the only asset to have negative correlation to equity at the 90th percentile for 5y horizon returns, and (of all the assets) was the most diversifying to Treasuries."
Read 8 tweets
5 Jan
1/ Will My Risk Parity Strategy Outperform? (Anderson, Bianchi, Goldberg)

"We gauge the potential of four strategies: value weighting, 60/40, unlevered and levered risk parity. Costs can reverse the ranking, especially when leverage is employed."

papers.ssrn.com/sol3/papers.cf… Image
2/ * U.S. stocks and U.S. Treasury bonds are inverse vol weighted (36-month rolling estimates)
* Monthly rebalancing
* Leveraged risk parity targets the ex post volatility of the market portfolio
* Trading costs are assumed to be 1% (1926-55), 0.5% (1956-70), and 0.1% *1971-2010) ImageImageImageImage
3/ "From 1926-2010, levered risk parity (financed at the 90-day T-bill rate) had the highest return. However, the performance was uneven."

NOTE: The U.S. stock/bond portfolio (no commodities) studied here may not be sufficiently diversified across asset classes. ImageImage
Read 9 tweets
4 Jan
1/ Option Trading Costs Are Lower than You Think (Muravyev, Pearson)

"Options price changes are predictable at high frequency. Effective spreads of traders who time executions are less than 40% of the size given by conventional measures."

papers.ssrn.com/sol3/papers.cf…
2/ * Trades and intraday bid/ask at one-minute frequencies for all U.S. listed equity options and the underlying stocks

* Option trades ≤ 10 cents, trades for which trade direction cannot be determined, and trades during the first and last five minutes of the day are removed
3/ "Conventional measures of transactions costs are large: The effective spreads are about 80% of the size of the quoted spreads. The price impacts are also large.

"ITM options have relative (dollar) spreads that are smaller (larger) than those of options in the full sample."
Read 17 tweets
4 Jan
1/ Term Structure of Short Selling Costs (Weitzner)

"Forward short selling costs (derived from put-call parity) predict future costs and stock returns. Short selling costs are higher over horizons when negative information is more likely to arrive."

papers.ssrn.com/sol3/papers.cf…
2/ * Dividend payers excluded
* Cost of shorting (median across strikes) over the term of the option is back-calculated using synthetic relationships, then forward rates are calculated
* Options with negative implied shorting costs are excluded
* Spot lending data is from Markit
3/ "If earnings announcements are periods when negative information is more likely to arrive, then the term structure's shape should be affected by when an announcement takes place.

"Options that expire after the earnings announcements do have higher annualized shorting costs."
Read 11 tweets

Did Thread Reader help you today?

Support us! We are indie developers!


This site is made by just two indie developers on a laptop doing marketing, support and development! Read more about the story.

Become a Premium Member ($3/month or $30/year) and get exclusive features!

Become Premium

Too expensive? Make a small donation by buying us coffee ($5) or help with server cost ($10)

Donate via Paypal Become our Patreon

Thank you for your support!

Follow Us on Twitter!