1/ When Diversification Fails (Page, Panariello)
"To fully appreciate extreme correlations, we take an in-depth look at stock-to-credit, stock-to–hedge fund, stock-to-private asset, stock-to-factor, and stock-to-bond correlations during tail events."
troweprice.com/content/dam/id…
"To fully appreciate extreme correlations, we take an in-depth look at stock-to-credit, stock-to–hedge fund, stock-to-private asset, stock-to-factor, and stock-to-bond correlations during tail events."
troweprice.com/content/dam/id…

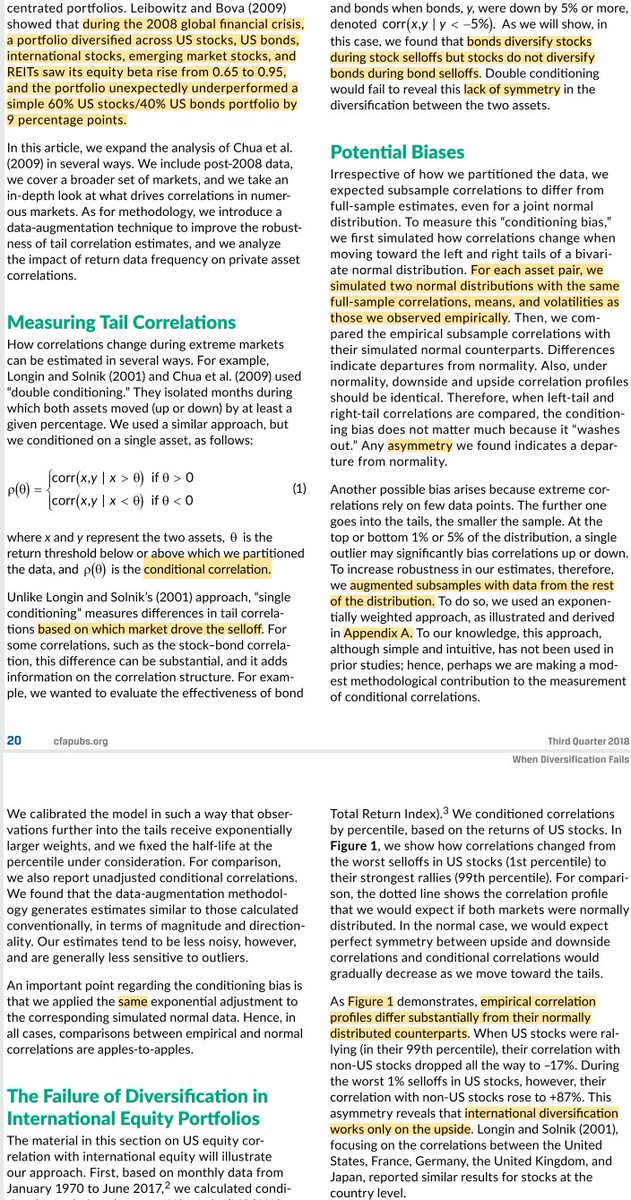
2/ "For each pair, we simulated two normal distributions using empirical full-sample correlations, means, & volatilities."
"Empirical correlation profiles differ substantially from their normally-distributed counterparts: International diversification works only on the upside."
"Empirical correlation profiles differ substantially from their normally-distributed counterparts: International diversification works only on the upside."

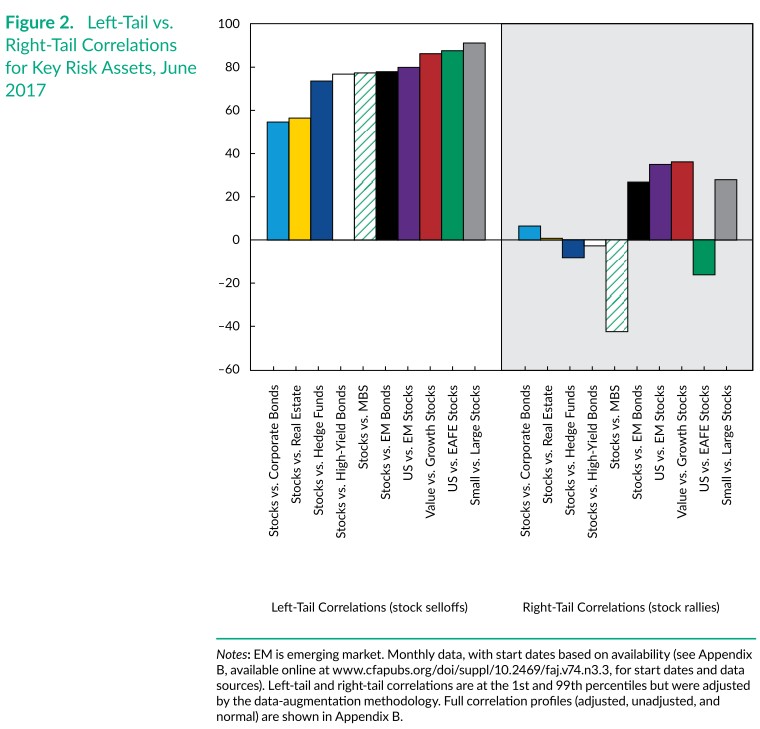
3/ "We found similar results across risk assets.
"We use bond returns net of duration-matched U.S. Treasuries ('excess returns') to isolate credit risk factors.
"Across the board, left-tail correlations are much higher than right-tail correlations."
"We use bond returns net of duration-matched U.S. Treasuries ('excess returns') to isolate credit risk factors.
"Across the board, left-tail correlations are much higher than right-tail correlations."
4/ "All the hedge fund styles, including the market-neutral funds, exhibit significantly higher left-tail than right-tail correlations.
"A simple explanation could be that most hedge fund strategies are short volatility. Some are also short liquidity risk."
"A simple explanation could be that most hedge fund strategies are short volatility. Some are also short liquidity risk."

5/ "Not only is the true equity risk of private assets higher on *average*, but left-tail exposures are also higher.
"Annual correlations are less sensitive to smoothing: reported quarterly returns for private assets represent a moving average of true (unobserved) MTM returns."
"Annual correlations are less sensitive to smoothing: reported quarterly returns for private assets represent a moving average of true (unobserved) MTM returns."

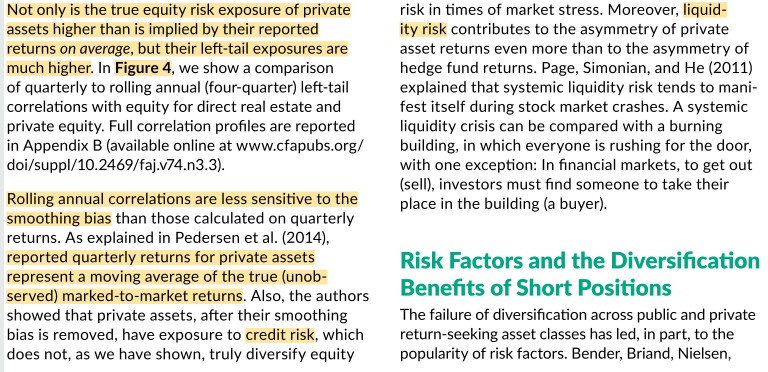
6/ "Again focusing on diversification vs. U.S. stocks, several L/S risk factors indeed appear to be more immune to the failure of diversification than are asset classes.
"This may result from the removal of the long-only constraint and the expansion of the investment universe."
"This may result from the removal of the long-only constraint and the expansion of the investment universe."
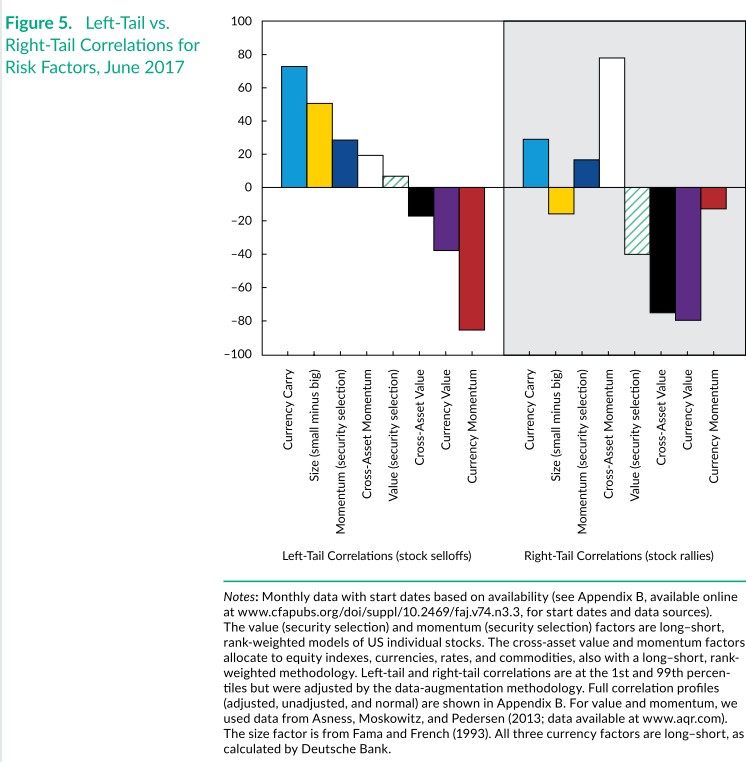

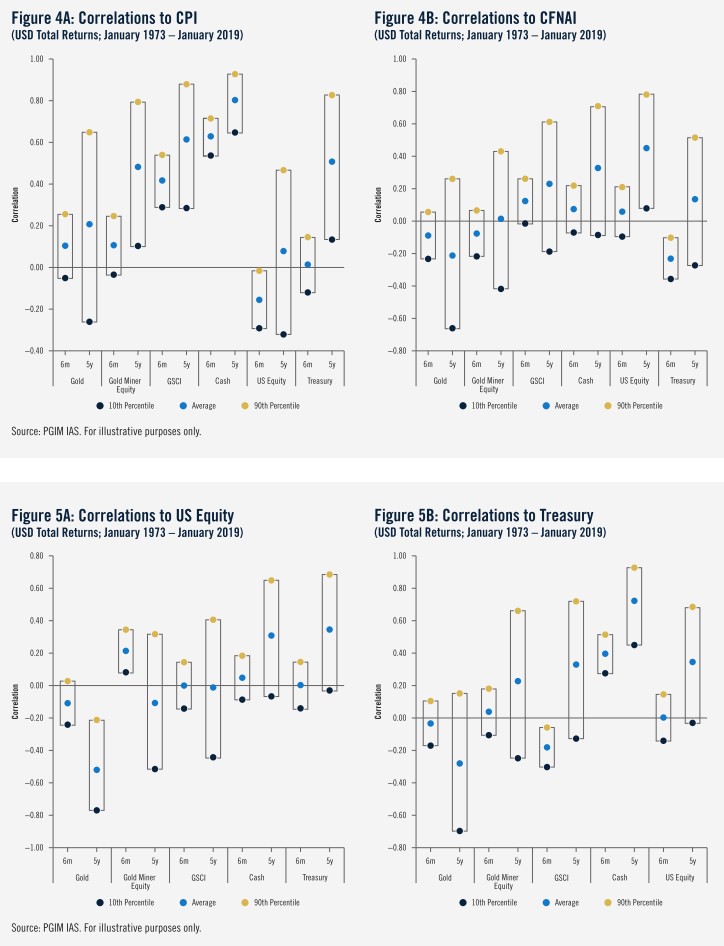
7/ "Duration risk may be the only true source of diversification in multi-asset portfolios.
"But when inflation and interest rates drive market volatility more than business cycles and risk appetites do (the 1970s and 1980s), the stock–bond correlation often turns positive."
"But when inflation and interest rates drive market volatility more than business cycles and risk appetites do (the 1970s and 1980s), the stock–bond correlation often turns positive."
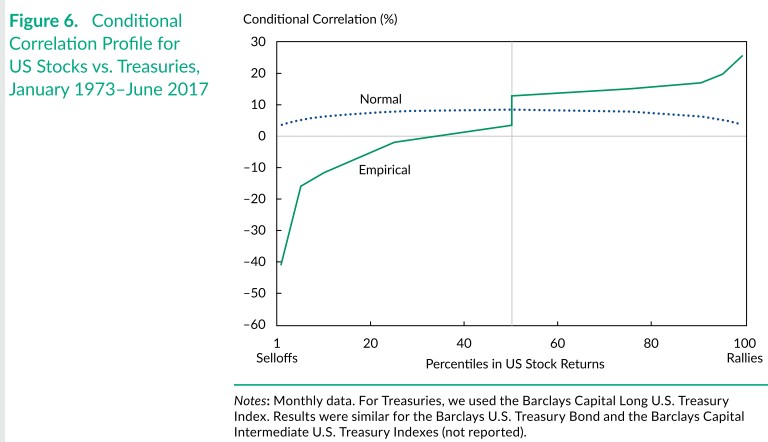
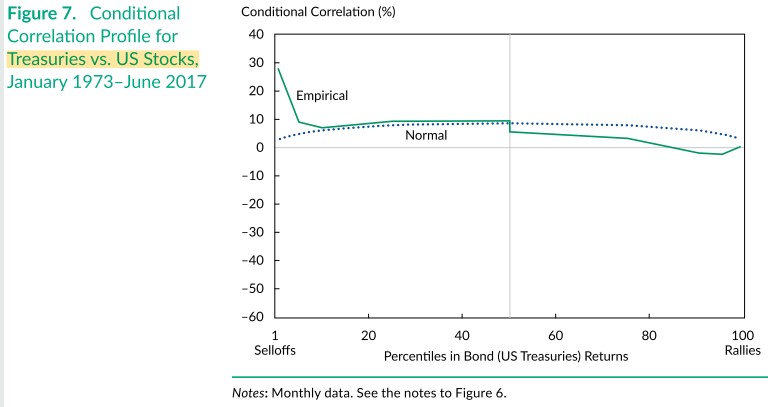
8/ "We then estimated the stock–bond correlation as a function of percentiles in *bond* returns instead of stock returns.... the correlation profile is now not as desirable.
"Although the correlations are generally low, when bonds sell off, stocks can sell off at the same time."
"Although the correlations are generally low, when bonds sell off, stocks can sell off at the same time."
9/ "Caveat: this represents only one way to measure diversification. Conditional betas, for example, take into account changes in relative volatilities as well as correlations.
"We recommend that investors avoid the use of full-sample correlation in portfolio construction."
"We recommend that investors avoid the use of full-sample correlation in portfolio construction."
10/ "Scenario analysis, either historical or forward-looking, should take a bigger role in asset allocation than it does.
"Tail hedging, L/S factors, defensive momentum, and dynamic volatility targeting provide better left-tail protection than does traditional diversification."
"Tail hedging, L/S factors, defensive momentum, and dynamic volatility targeting provide better left-tail protection than does traditional diversification."
11/ Related research:
The Impact of Volatility Targeting
The Death of Diversification Has Been Greatly Exaggerated
The Impact of Volatility Targeting
https://twitter.com/ReformedTrader/status/1081840601610387458
The Death of Diversification Has Been Greatly Exaggerated
https://twitter.com/ReformedTrader/status/1200558223180230656
12/ Strategic Allocation to Commodity Factor Premiums
Demystifying Illiquid Assets: Expected Returns for Private Real Estate
https://twitter.com/ReformedTrader/status/1204964215120809985
Demystifying Illiquid Assets: Expected Returns for Private Real Estate
https://twitter.com/ReformedTrader/status/1287504178076557312
13/ In the paper Investing with Style, Asness et al. found that factors constructed in a very diversified way provided helpful performance during the worst 10% of months for global equities:
https://twitter.com/ReformedTrader/status/1233560649159991296
• • •
Missing some Tweet in this thread? You can try to
force a refresh