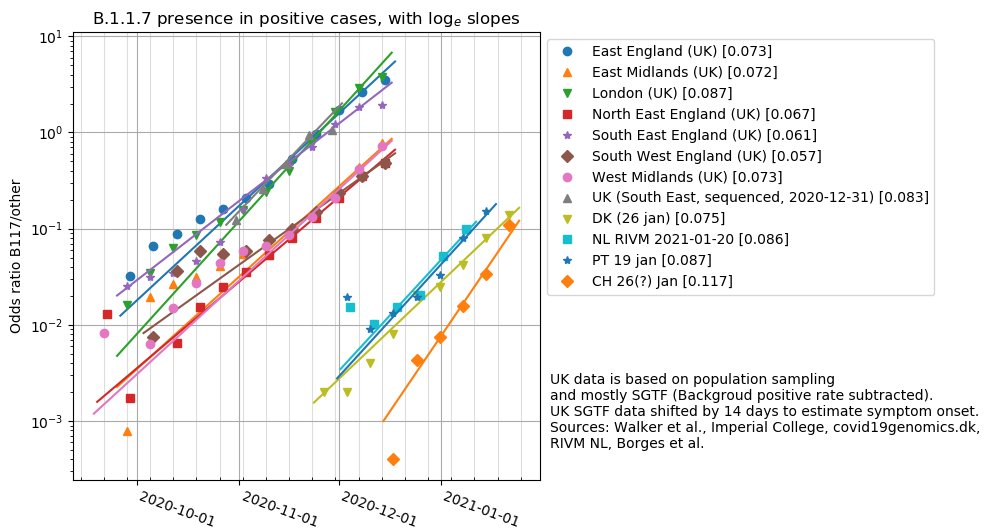
1/ In a recent publication, Walker et al. [medrxiv.org/content/10.110…] suggested that the B.1.1.7 coronavirus strain was less transmissible than previously thought, growing only 6 %/day relative to other strains, rather than 11 %/d. Let's have a closer look. #B117
2/ Fig. 4 shows a daily growth factor 1.04 (=4 %/d) for recent data (after "late November") and 1.09 for earlier data. However, the actual growth curves are not shown; rather, fig. 2 shows curves for SGTF and non-SGTF samples.
3/ I traced the curves in fig. 2, which results in the odds ratios SGTF/(not SGTF) (among covid-positive cases) as below. The log slope values are the daily increases; [0.056] means a daily factor 1.056. Also shown: data from sequencing for one UK region and other countries.
4/ There seems to be a background; apparently, some samples have SGTF without being infectious (something else than B.1.1.7). Subtracting the lowest point (presumably background) results in near-exponential growth of the odds ratios with log slopes between 5.7 %/d and 9.2 %/d.
5/ (The slopes are fits on the 6th to 2nd most recent weeks). An odds-ratio slope of 6 %/d seems to be rather optimistic. Generally, only the most recent week is below the trend, if at all. Also note that the SE curve based on sequencing (Volz et al.) has slope 9.4 %/d.
6/ What could cause the odds-ratio slope to decrease over time? Exponential growth is only expected if the competing 'other' strains all have the same R number. If the other strains have a range of R values, you'd expect the slope to decrease.
7/ Here is an example for a mix of three variants with R values 0.8, 1.0, and 1.25 (assuming generation interval 4 d). The odds-ratio slope decreases, but that doesn't mean that the initial estimate for the infectiousness of variant 'c' is too pessimistic!
9/ Update: one more DK data point (preliminary data). The exponential slope fitting is changed: it was igoring the latest data point (often preliminary); it now uses them with reduced weight, resulting in slightly different slope values compared to before.
I forgot to update the DK label in the plot above. It's the 26 Jan data of DK, of course. Corrected.
1/ Here are the growth curves of the #B117 UK variant as the ratio between the B.1.1.7 versus other strains, for different regions (two UK regions; Denmark, Netherlands, Portugal). The the relative growth per day is indicated: [0.100] means 10% per day.
2/ Note the logarithmic scale: exponential growth = straight line. Although recent UK data indicates that the growth decreased to ~0.03 /day in Dec [medrxiv.org/content/10.110…], the growth rate in DK, NL, and PT is all ~0.08/day. Zoomed graph:
3/ Depending on the assumed generation interval, that means that B117 has an R value between 1.4 (4 days) and 1.6 (6 days) higher than the old strain. In the Netherlands, the authorities assume a very optimistic factor 1.3 (per 4 days).
1/ Prognose infectiecijfers met avondklok. Aanname: -10% op R. Model gebaseerd op de waargenomen exponentiële groei van de verhouding van varianten UK/overig en de waargenomen trend in positieve testcijfers. Logaritmische y-as: rechte lijn = exponentiële groei. #B117
2/ N.B. Vaccinaties niet meegeteld. De avondklok helpt, maar is niet genoeg. Let wel: exponentiële processen zijn erg gevoelig voor de modelparameters. De groei van B117 t.o.v. overig is zeer vergelijkbaar tussen NL, UK en DK met verdubbelingstijd 6-9 dagen.
3/ In NL is de verdubbelingstijd van de B117/overig-verhouding 6 dagen. RIVM lijkt te rekenen met een verdubbelingstijd van 11 dagen, d.w.z. een R die 30% hoger is (t.o.v. 60% hoger op basis van de data).
Waarom zijn wasbare mondkapjes uit de winkel zo beroerd? Ik maak ze zelf. Goede afsluiting (zelden beslagen brillenglazen), goede filterwerking en comfortabel door de lage ademweerstand. Het filtermedium ligt in je keukenkastje: gele viscosedoekjes. 1/5
Die uit de winkel: zelden met metalen neusdraad; ofwel doorzichtig, ofwel zo dicht dat de ademlucht grotendeels via de kieren stroomt. Hoe weet ik dat die van mij goed werken? Als mijn partner wierook brandt, ruik ik die bijna niet met zo'n kapje op. En met een proefje: 2/5
Rook van wierook en sigaretten bestaat grotendeels uit aerosoldeeltjes van circa 0.3 μm diameter, precies de maat waarvoor HEPA en FFP2 getest worden. De technische details: docs.google.com/document/d/1X9…. 3/5
De NL cijfers voor positieve tests zijn interessanter als aantallen per eerste ziektedag in plaats van aantallen gerapporteerd. Dit is echter lastig uit de anonimiseerde data te destilleren. Er is toch wat over te zeggen: @jannoTR@YorickB@mzelst 1/4
Die vertraging is in recente weken ongeveer 4.5 dag. Ik snap niet helemaal waarom het zo lang is (afspraak maken + testen + uitslag = 2-3 dagen?), ook gezien de incubatietijd (5 dagen) en de 7 dg vertraging tussen reproductiegetal en dagcijfers. Suggesties welkom. 2/4
Methode: bepaal de verschuiving tussen de 1e ZD curve en positievetestcurve door naar de cumulatieven te kijken. De laatste 2 wk van de 1ZD-curve zijn geschat. Niet alle casussen hebben een 1ZD-datum; in die gevallen veronderstel ik die 2-3 dagen in het verleden. 3/4
Imperial College just released a report on the UK coronavirus variant of concern. The growth rates measured over November are significantly different from an earlier report. The good news is that the growth-rate estimate was lowered. @erikmvolz 1/3
The increase in Rt would be a factor 2.0 versus a factor 1.6 (based on 6.5 days generation interval). But what changed? In both cases, it is based on genomic sequencing. Anyone knows? 2/3
Morgen (dinsdag) komt de wekelijkse update van het reproductiegetal Rt. Bij de vorige zes was de voorlopige Rt gemiddeld 0.2 punten te laag ingeschat. 1/4
Op basis van de dagelijkse infectiecijfers (data t/m maandag) zaten we op 16 oktober op Rt=1.05±0.05, wat zou betekenen dat RIVM er vorige week niet te ver naast zat. Op 20 oktober zaten we op Rt=0.95±0.05. (Source code: github.com/han-kwang/covi…) 2/4
Aangezien met de maatregelen vanaf 14 oktober de Rt niet ruim onder de 1 is gezakt, is een verdere aanscherping inderdaad nodig.
Tot er een vaccin is, moet elke periode met Rt>1 (vrijheid, blijheid) worden gecompenseerd met een periode met Rt<1 (strenge maatregelen). 3/4