Woof sorry this post is from the talented @angelicalavito, who spoke to the state's department of health about what's happening.
Here's where California ranks currently -- they have moved up from dead last.
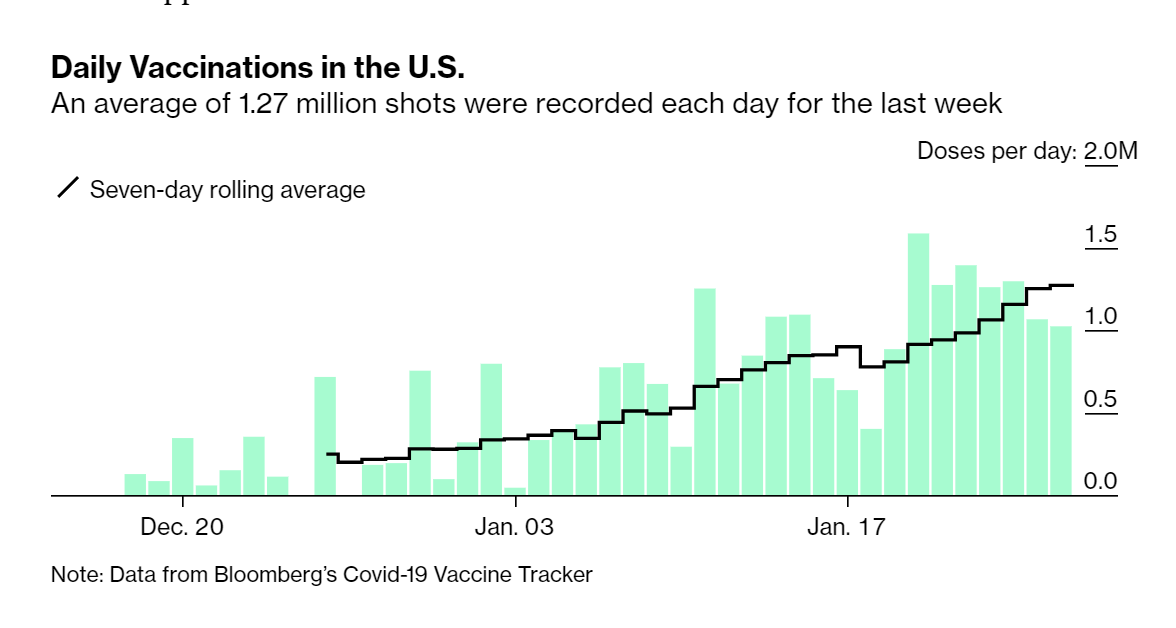
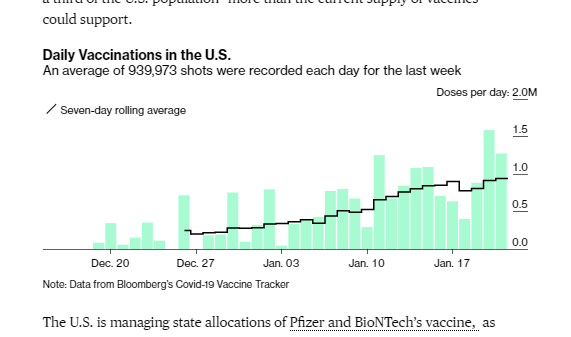
So why is California seemingly using so few of its doses?
🖱️The state's department of health says they ARE using the doses, but people on the front lines logging the data weren't hitting a certain button at the end of day. (Yes, really.)
We will now show rolling 7-day averages for each state, as well as % of pop with first and second doses in our sortable tables. bloomberg.com/graphics/covid…
So what's up with California, which is always at the bottom of the ranking for "% of doses used"?
🤦♂️Basically it sounds like *part* of the problem was that people around the state weren't hitting "submit" at the end of the day, @angelicalavito reports.
Here is out US map of the % of doses that have been delivered than have been used. There are still BIG disparities in this rate. We are investigating why -- especially California -- and hope to have more to share there ASAP. bloomberg.com/graphics/covid…
⚠️CDC updated today -- first time on the weekend IIRC -- which is great. It will also reduce Monday lag/bump. (As usual, many states did not -- but we get the CDC number in their place.)
⚠️The CDC has switched from reporting doses SHIPPED to doses DELIVERED. This means that our map and table now reflect what CDC says state have within their borders.
This ends the lag of doses being shipped but in transit that had made % used seem lower.
We heard a LOT from states (understandably) about the old method. CDC has told us they were hearing the same, and wanted to reflect reality on the ground as best they could.
So if you are complaining about your state, you are doing it with better data now.
1) Added CDC data 2) Used state counts when ahead of CDC 3) Made some BIG updates to the map + table -- you can see doses been shipped to states + what % of doses have been used