💉🇺🇸VACCINE DATA UPDATE (Jan. 25)🌏💉
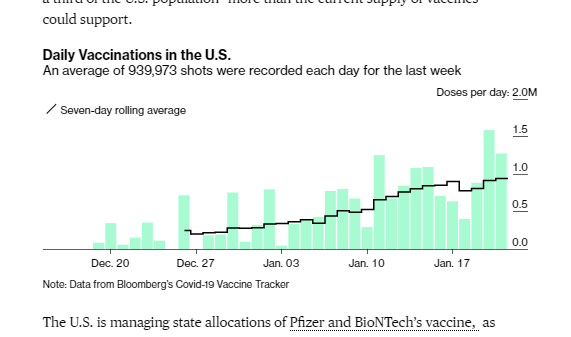
🇺🇸US: 23.1M doses admin
➕723k doses today; 📈7-day avg=1.2M
🏅3.38M people completed vaccination
🌏67.8M doses (daily rate ~3.39M)
⚠️CDC *DID NOT* update today (lowers day total/avg)
bloomberg.com/graphics/covid…
🇺🇸US: 23.1M doses admin
➕723k doses today; 📈7-day avg=1.2M
🏅3.38M people completed vaccination
🌏67.8M doses (daily rate ~3.39M)
⚠️CDC *DID NOT* update today (lowers day total/avg)
bloomberg.com/graphics/covid…

So what's up with California, which is always at the bottom of the ranking for "% of doses used"?
🤦♂️Basically it sounds like *part* of the problem was that people around the state weren't hitting "submit" at the end of the day, @angelicalavito reports.
bloomberg.com/news/live-blog…
🤦♂️Basically it sounds like *part* of the problem was that people around the state weren't hitting "submit" at the end of the day, @angelicalavito reports.
bloomberg.com/news/live-blog…
Here are your U.S. leaders.
⚠️The lack of a CDC update tends to depress numbers substantially.
bloomberg.com/graphics/covid…
⚠️The lack of a CDC update tends to depress numbers substantially.
bloomberg.com/graphics/covid…

🚨LOL okay so CDC has *just* updated and we'll add their numbers in shortly. Thanks for playing everyone.
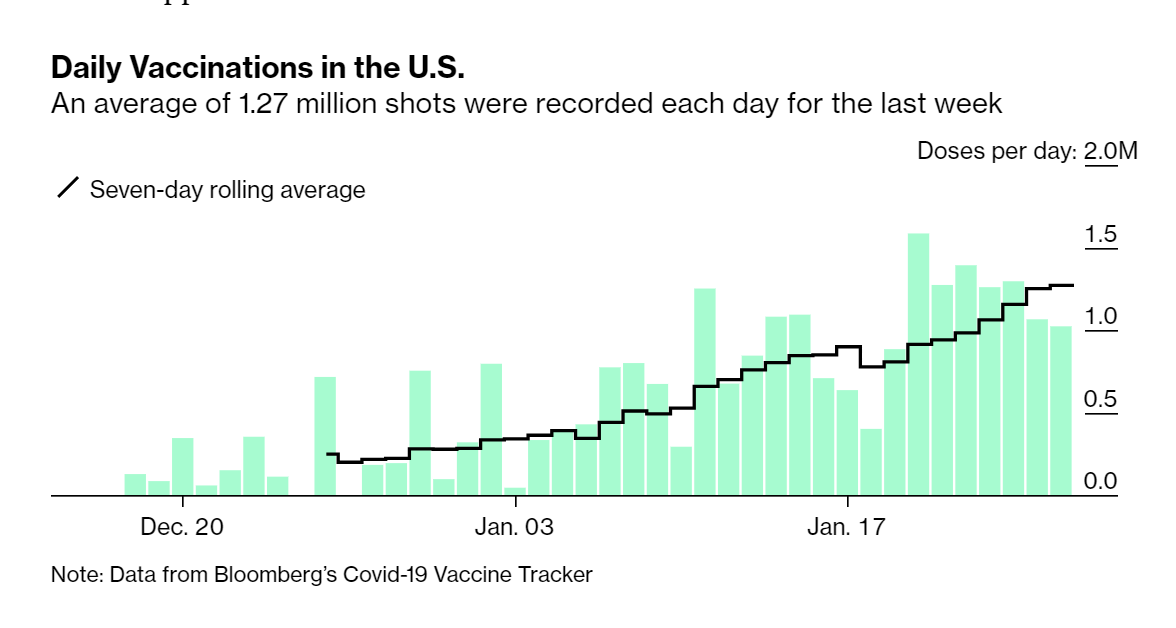
🇺🇸And here we are with the late CDC update that missed our usual data window.
💉1.1M doses for the day
📈7-day average = 1.3M doses/day
💉1.1M doses for the day
📈7-day average = 1.3M doses/day

🏆This means SIX days in a row above 1M doses/day. Looking more and more like vaccinations (or data reporting of vaccinations) have taken a turn upward.
bloomberg.com/graphics/covid…
bloomberg.com/graphics/covid…
Why does CDC update data when it does
¯\_(ツ)_/¯
They *usually* come out in early afternoon. But not always. And their numbers (as you can see) weight heavily in our overall count.
¯\_(ツ)_/¯
They *usually* come out in early afternoon. But not always. And their numbers (as you can see) weight heavily in our overall count.
And the last thing I'll say tonight, about the California data (non) reporting issues, is that:
1) Yes there is data lag
2) Nobody REALLY knows how much
3) So let's not assume it's everything going on here
bloomberg.com/news/live-blog…
1) Yes there is data lag
2) Nobody REALLY knows how much
3) So let's not assume it's everything going on here
bloomberg.com/news/live-blog…
• • •
Missing some Tweet in this thread? You can try to
force a refresh