Jan 20 Weekly Update: New vaccinations (750k/day) are still increasing, but at a slower pace. 1st doses saw a 30% increase over last week, compared to 76% increase the week before.

We are the only site that tracks vaccine doses since December: covid19-projections.com/path-to-herd-i…
By state, Alaska and West Virginia lead the pack, with over 7% of the population receiving at least 1 dose.

In contrast, Nevada and Alabama have less than 3% of the population receiving at least 1 dose.

See more maps: covid19-projections.com/maps-infection…
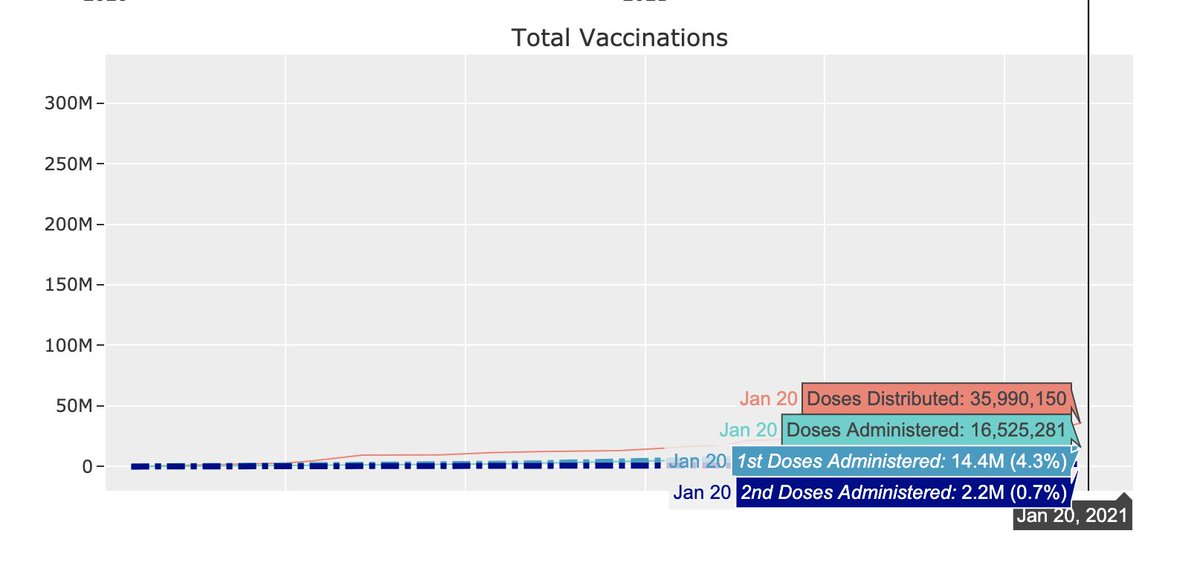
As of today, over 14M people have received at least 1 dose, or 4.3% of the population.

36M doses have been distributed. Our "percent doses used" metric is under 50%.

Efficiency can be greatly improved.
We created a map of the "% doses used" metric (covid19-projections.com/maps-infection…).

North Dakota, South Dakota, & West Virginia have used more than 65% of their doses.

California, Virginia, and Alabama are in the bottom 3, having used less than 40% of their doses.
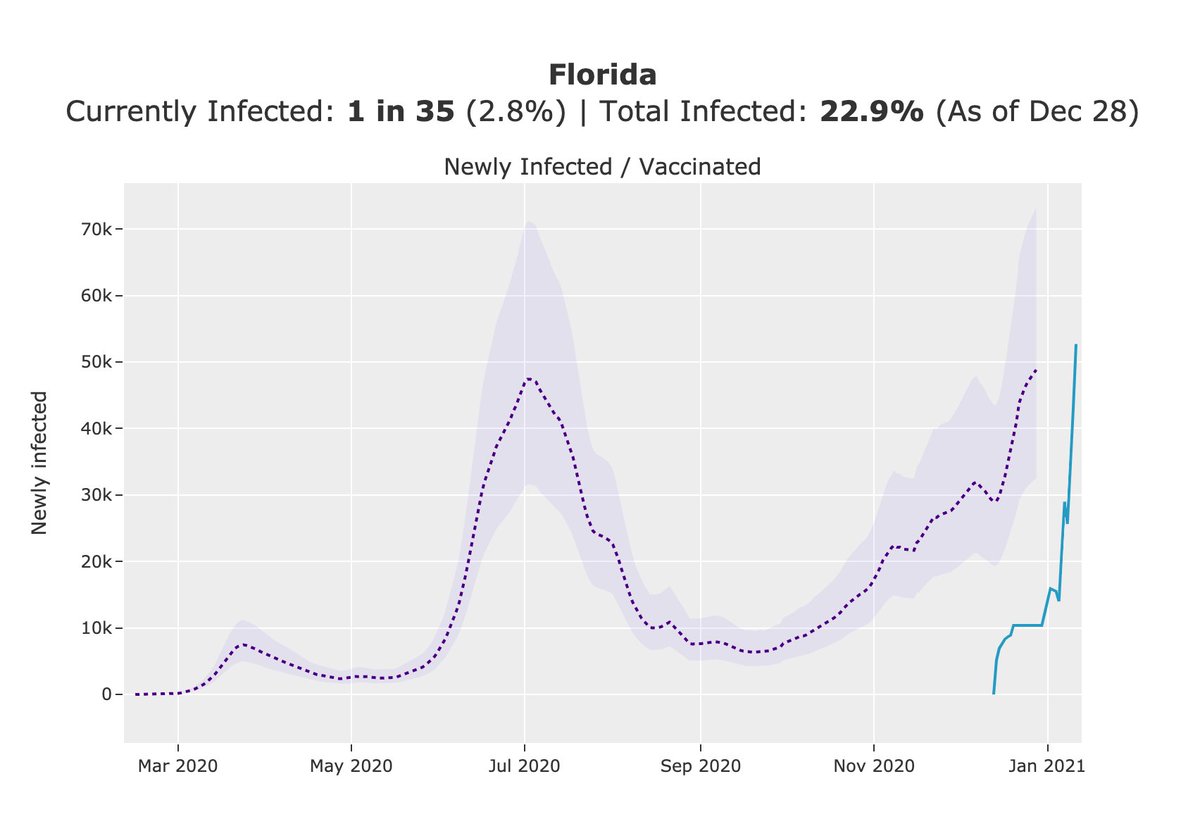
The good news is that new daily vaccinations have now likely exceeded the number of new daily infections.

But with only 0.7% (2.2M) of the population having received both doses, we still have a long way to go.

• • •

Missing some Tweet in this thread? You can try to force a refresh
 

Keep Current with Youyang Gu

Youyang Gu Profile picture

Stay in touch and get notified when new unrolls are available from this author!

Read all threads

This Thread may be Removed Anytime!

PDF

Twitter may remove this content at anytime! Save it as PDF for later use!

Try unrolling a thread yourself!

how to unroll video
  1. Follow @ThreadReaderApp to mention us!

  2. From a Twitter thread mention us with a keyword "unroll"
@threadreaderapp unroll

Practice here first or read more on our help page!

More from @youyanggu

14 Jan
There appears to be an error on the CDC website.

The @CDCgov page currently claims 11M people have initiated COVID-19 vaccination, but the underlying data suggests that it's actually 11M *doses*.

This is quite misleading, and I hope this error is corrected ASAP.
I took some time to correct for this myself. Our vaccination page now breaks down administered doses into 1st & 2nd doses: covid19-projections.com/path-to-herd-i…

According to our estimates, 10M people (not 11.1M) have received at least one dose. Out of those 9M, 1.1M have received both doses.
After this adjustment, the current pace of new vaccinations is ~4M people per week. Even if we double that pace, it would take 9 months to vaccinate everyone.

As of now, ~15% of the daily doses given are used as a 2nd dose (114k / 747k). I expect this fraction to grow over time.
Read 5 tweets
12 Jan
New feature! We are now including vaccination status (according to @CDCgov) on all covid19-projections.com plots for every US state (and nationally).

Find out how quickly your state is vaccinating people here: covid19-projections.com/#view-us-infec…
For example, states like Florida and New York are quickly vaccinating more people than new infections, while states like California and Georgia are still lagging behind.
See my short thread from yesterday for more vaccination data + projections.

Read 4 tweets
7 Jan
Are high levels of existing COVID-19 population immunity in US counties associated with a lower infection rate in this current wave?

This thread contains my latest findings to this question.

Initial conclusion: No, there is practically no correlation.
The plot above shows the the percentage of the population infected before Sep 1 & after Sep 1 in each county (based on covid19-projections.com estimates).

The question is: can knowing the % infected before Sep 1 in a county predict the relative severity of this current wave?
When looking at all 3,000+ counties, the answer is no. There is practically no correlation (R^2 = 0.002) between the % infected before Sep 1 and after Sep 1.

So given a county, the COVID-19 prevalence before Sep 1 has no predictive value in determining the severity since Sep 1.
Read 26 tweets
5 Jan
Out of 137 US counties with >500,000 residents, the top five currently worst-hit counties are all in California.

We estimate 1 in 16 residents in those counties are currently infected with COVID-19.

See more in our new US County Summary page: covid19-projections.com/infections/sum…
So how does LA now compare to NYC at its peak?

We estimate NYC had 1 in 8 residents infected at its peak in March 2020. So LA is currently at half of NYC's peak.

Deaths are likely lower than half due to a lower IFR than in the spring.
Read 5 tweets
29 Dec 20
A lot of people have asked why the CDC estimates close to 100M total US COVID-19 infections (28%) by Dec 1, while covid19-projections.com only estimates 58M (17%).

I believe there are major flaws in the CDC estimates, which I will explain in this thread.

cdc.gov/coronavirus/20…
To begin, the covid19-projections.com model is tuned on serology surveys, while the CDC model is not.

While CDC estimates 7x more COVID-19 infections than reported, covid19-projections.com estimates this ratio to currently be ~3x, down from 10x in April and 4x in the summer.
Using the CDC claim that "1 in 7 total infections were reported", this would imply that 70% of North & South Dakota were infected, which doesn't pass a common sense test.

While a 7x multiplier is believable in the spring, the paper still claims this is the case in September.
Read 18 tweets
15 Dec 20
If we vaccinate 10 million people today, statistically 300 of them will die the very next day. Regardless if they actually got vaccinated or not.

Over the next months, it's important to watch for misinformation that blames adverse events on the vaccine.

Below is an example of the misinformation that can spread.

The annual incidence of Bell's palsy is ~25 per 100k. There were 4 cases out of 40k participants.

The FDA concluded it's "consistent with the expected background rate in the general population."

In statistics, this is a simple application of something called Bayes Rule.

In essence, we must consider the likelihood of an event happening independently.

For ex: a 90-year-old has a 1 in 6 chance of dying within a year. So this happening after a vaccine would not be unusual.
Read 4 tweets

Did Thread Reader help you today?

Support us! We are indie developers!


This site is made by just two indie developers on a laptop doing marketing, support and development! Read more about the story.

Become a Premium Member ($3/month or $30/year) and get exclusive features!

Become Premium

Too expensive? Make a small donation by buying us coffee ($5) or help with server cost ($10)

Donate via Paypal Become our Patreon

Thank you for your support!

Follow Us on Twitter!