As 2020 prelim. total mortality data now reasonably complete, here is an update on the age-standardised analysis for 2000-2020 for Finland Norway Sweden.
Although Sweden 2020 is of interest, a comparison between Finland/Norway is interesting too.
1/17
Although Sweden 2020 is of interest, a comparison between Finland/Norway is interesting too.
1/17
https://twitter.com/MarkkuPeltonen/status/1282066119914926080
Starting with Fig 1, the absolute numbers of deaths per year in Sweden, Norway, Finland.
Sweden as the largest country has naturally most deaths. Year 2020 stands out.
But Finland and Norway: almost the same population size; why Norway fewer deaths + the trends diverging?
2/
Sweden as the largest country has naturally most deaths. Year 2020 stands out.
But Finland and Norway: almost the same population size; why Norway fewer deaths + the trends diverging?
2/

Population sizes generally growing over time in the nordics. Despite this, the total number of deaths has been rather stable in Fig 1, Sweden (except 2020) and Norway actually decreased despite more people.
Note also how Finland stands out in population growth.
3/
Note also how Finland stands out in population growth.
3/

We can express the nr of deaths per a fixed number; for example “per million”, as in Fig 2. How many would have died if the pop. was 1 million in each country? Easier to compare cntries+over time.
Need to know pop. sizes + deaths for every year. The measure is now a “rate”.
4/
Need to know pop. sizes + deaths for every year. The measure is now a “rate”.
4/
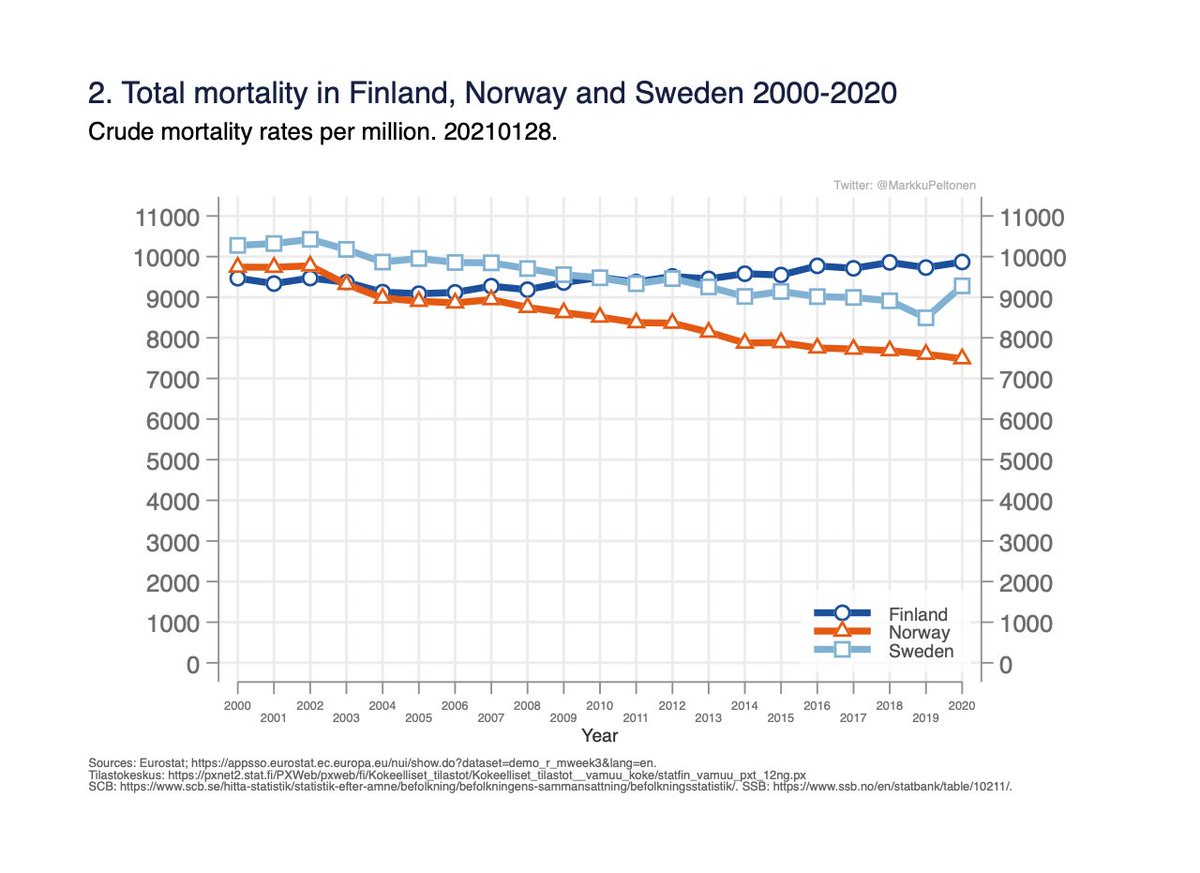
A rate describes how many deaths occur per some fixed population (here million) and time unit (here per year).
This rate is also called “crude rate” in epidemiology, as it only takes into account the population sizes over years, nothing else.
5/
This rate is also called “crude rate” in epidemiology, as it only takes into account the population sizes over years, nothing else.
5/
Measured this way, we can now compare deaths in the countries even though the population sizes differ:
- Norway has lowest rate and decreasing.
- Sweden had highest, but has decreased.
- Finland was lowest but increased and now highest.
Why these differences?
6/
- Norway has lowest rate and decreasing.
- Sweden had highest, but has decreased.
- Finland was lowest but increased and now highest.
Why these differences?
6/
Age is strongly associated with mortality so the next step is to figure out if there are any differences in how old people in different countries are.
Median ages 1990 -> 2015:
- Finland 36.4 -> 42.5
- Sweden 38.4 -> 40.9
- Norway 35.4 -> 39.2
7/
ourworldindata.org/age-structure
Median ages 1990 -> 2015:
- Finland 36.4 -> 42.5
- Sweden 38.4 -> 40.9
- Norway 35.4 -> 39.2
7/
ourworldindata.org/age-structure
Norway with youngest population has lowest crude mortality rate in Fig 2, as would be expected.
Sweden used to be oldest, but ageing has been slower than in Finland/Norway.
Finland now oldest, ageing has been more rapid.
8/
Sweden used to be oldest, but ageing has been slower than in Finland/Norway.
Finland now oldest, ageing has been more rapid.
8/
Number of things affect pop. age-structure eg:
- differences/changes in public health (mortality due to disease burden, lifestyle eg smoking, etc)
- fertility (number of children per woman)
- immigration (I assume immigrants on average younger than general population).
9/
- differences/changes in public health (mortality due to disease burden, lifestyle eg smoking, etc)
- fertility (number of children per woman)
- immigration (I assume immigrants on average younger than general population).
9/
Fertility rates not favouring Finland: 1.77 vs Norway 1.82, Sweden 1.91 births/woman.
Thus, Finland not getting as many young into the population as the others.
Immigration more common in Sweden, also Norway more than twice as many foreign-borns.
(ourworldindata.org/fertility-rate)
10/
Thus, Finland not getting as many young into the population as the others.
Immigration more common in Sweden, also Norway more than twice as many foreign-borns.
(ourworldindata.org/fertility-rate)
10/
One can take into account the differences in age by calculating the rates expressed per a *common age distribution.
Need data on pop. size in all age groups and all years, as well as nr of deaths in all age groups for all the years.
11/
Need data on pop. size in all age groups and all years, as well as nr of deaths in all age groups for all the years.
11/
This corresponds to the “per million”-calculation above (sort of), "per common nr people" (to account for differences in population sizes), same principle.
Calculation is quite simple, see for example (or google “direct standardisation”):
12/
healthknowledge.org.uk/e-learning/epi…
Calculation is quite simple, see for example (or google “direct standardisation”):
12/
healthknowledge.org.uk/e-learning/epi…
This is called age-standardization (or age adjustment): the rates tell the mortality *as if the age-structure had been the same in different years and populations.*
Generally, the rates have been declining everywhere, Fig 3.
13/
Generally, the rates have been declining everywhere, Fig 3.
13/
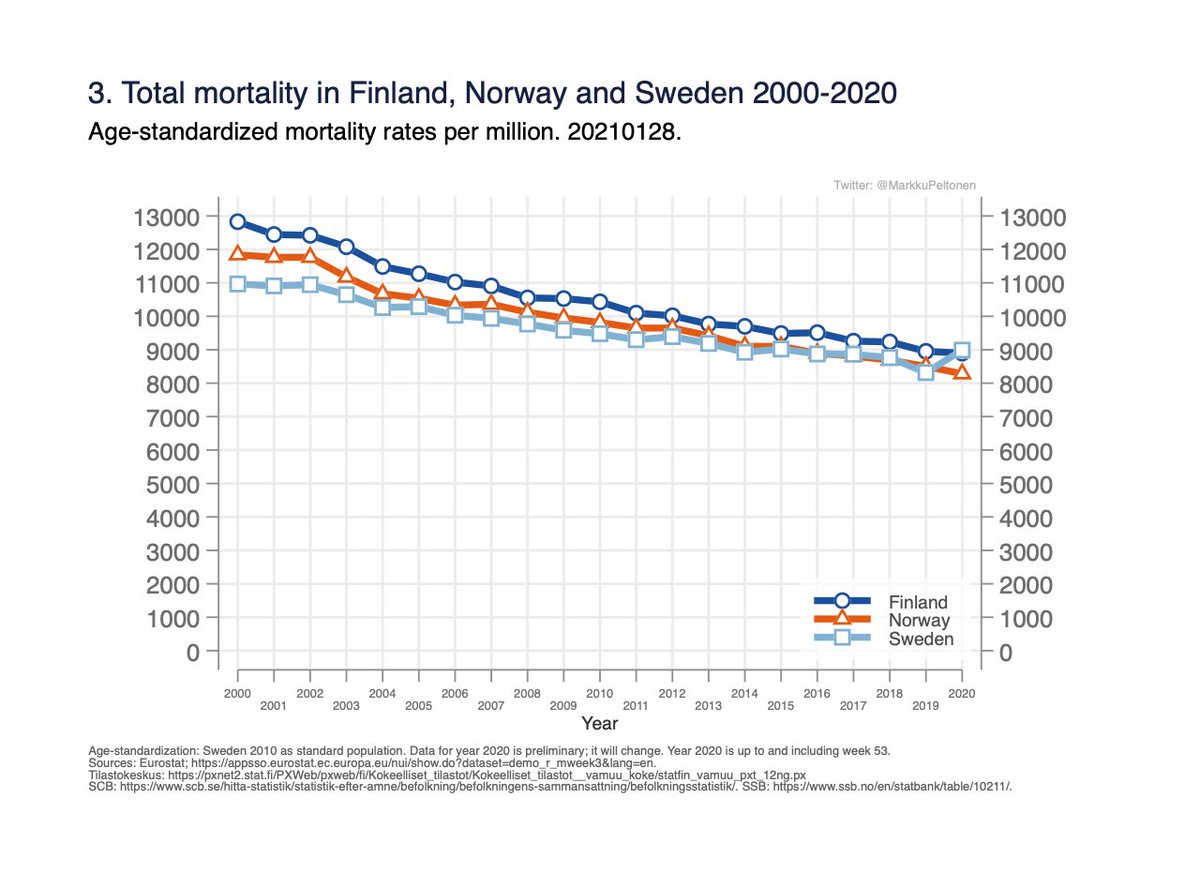
I chose to use Swedens age distribution year 2010 as reference (choise does not matter for comparison, but affects absolute values).
Thus, rates in Fig 3 are for “one million population with age-distribution as in Sweden in 2010”, for each country.
14/
Thus, rates in Fig 3 are for “one million population with age-distribution as in Sweden in 2010”, for each country.
14/
Still small difference between Norway/Finland in Fig 3, not explained by differences in age/pop. size.
Next step: check common diseases, lifestyle associated w mortality (smoking, obesity..) in the cntries. (Will not go there; it is the middle-aged finnish men with excess.)
15/
Next step: check common diseases, lifestyle associated w mortality (smoking, obesity..) in the cntries. (Will not go there; it is the middle-aged finnish men with excess.)
15/
The differences seen in age-standardized rates in Fig 3 are also reflected in life-expectancy at birth (WHO 2019):
Finland: 81.6 years
Sweden 82.4
Norway: 82.6
16/
Finland: 81.6 years
Sweden 82.4
Norway: 82.6
16/
It is possible to standardise for other background factors which might differ between countries/change over time, the principle is the same.
(In fact, the “age-standardised rates” here are also standardised for diffs. in nr of men and women in different countries/years.)
17/
(In fact, the “age-standardised rates” here are also standardised for diffs. in nr of men and women in different countries/years.)
17/
Summary:
- Sweden has had lowest mortality rates but this year lost this advantage.
- In comparisons to long term historical levels, one has to consider changes in population demographics.
- Comparing to historical levels, need to consider improvements in public health.
18/18
- Sweden has had lowest mortality rates but this year lost this advantage.
- In comparisons to long term historical levels, one has to consider changes in population demographics.
- Comparing to historical levels, need to consider improvements in public health.
18/18
• • •
Missing some Tweet in this thread? You can try to
force a refresh