Here's the change in North Carolina from the 2008 to 2020 presidential races. Both Obama and Trump narrowly carried the state. But basically every suburban precinct -- even in the smaller cities out east -- got more Democratic, while the rest of the state moved red.
The swing to Biden in precincts that were relatively "suburban" out east really stood out to me. Wilson, Rocky Mount, Kinston, Goldsboro, etc. Even a few around Lumberton(!).
Nash County (where Roy Cooper is from) has one of the more unique paths: it was McCain -> Obama -> Trump -> Biden. For Senate it was also Tillis '14 -> Cunningham '20.
The blue there is west of the city of Rocky Mount.
I also did the raw vote version of this like Matt did here. I’ll post that soon. Robeson County stands out a lot less 👀
Ironic that Dems are usually criticized as a 'coastal' party, but I think Georgia's relative *lack* of a coastline helps Dems -- it attracts fewer R retirees. The gains NC Dems made in New Hanover County (Wilmington) have easily been erased by R growth in Pender & Brunswick.
and this is even before you throw in Carteret and Craven.
It was close, but Brunswick County wouldn't even vote for Mike McIntyre in 2012 -- that's when it was gone for basically *any* Dem.
Had some other stuff planned but guess I’m gonna have to do a precinct map of this, to show some of you guys what I mean. Given what we’ve seen in other northern states, this was a reasonable inference to make.
And no, I’m not “blaming” any group or another for the result.
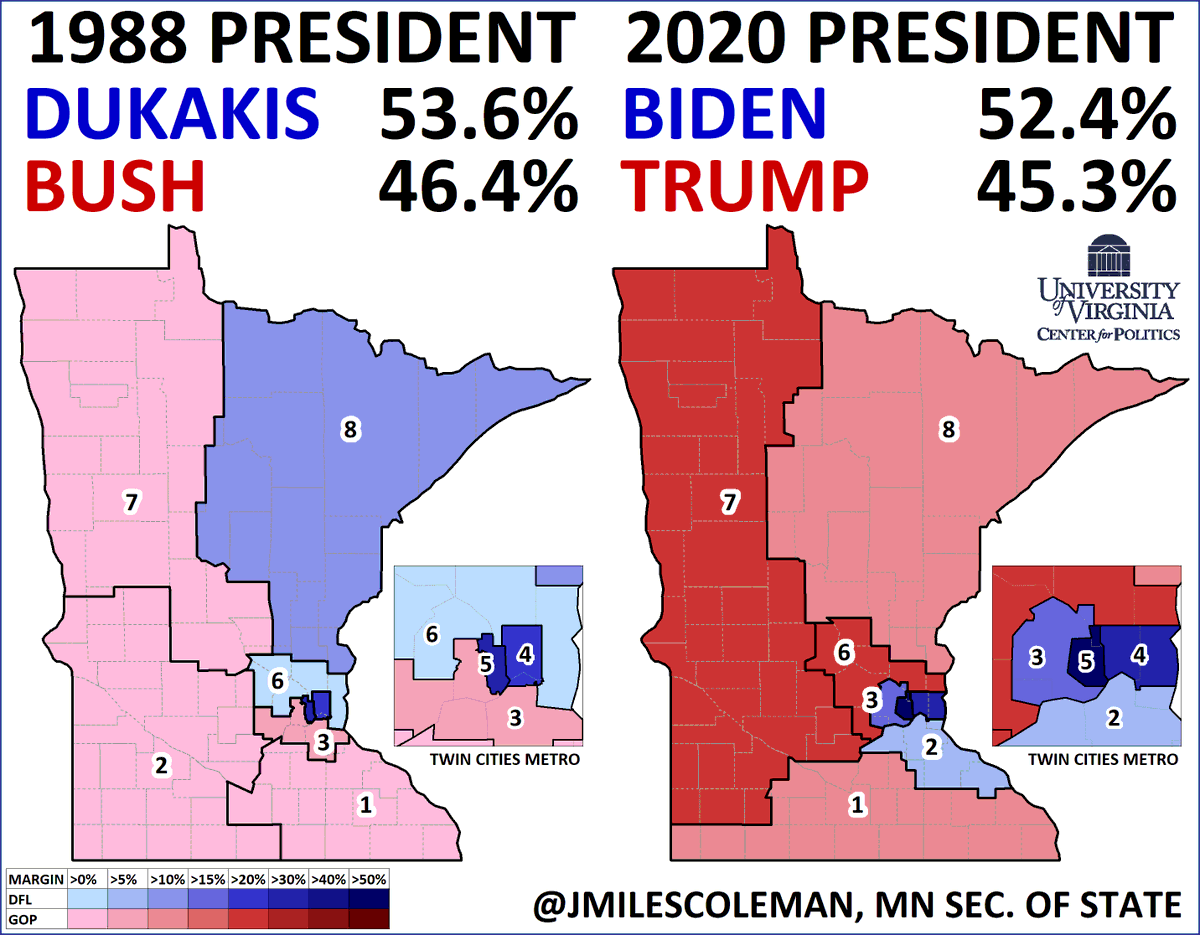
With its votes certified, Biden won Minnesota by just over 7%; the same overall result that Mike Dukakis got in 1988. The farm crisis helped Dukakis in Greater MN, which was lighter red. MN-8 is now an R-leaning district. But MN-4 (St. Paul) & MN-5 (Minneapolis) are darker blue.
One of those times where I wish we could edit tweets, but MN-8 should have been a shade *darker* blue in 1988. It was Dukakis +19%.
Was debating putting the CD breakdowns on the graphic, and I should have -- I would have caught this.
I seriously beat myself up about these small errors, but I think it's best to be transparent!
Around Philadelphia, Biden carried the four suburban collar counties by a combined 59%-40%. This was an improvement from Clinton's 55%-41% margin in 2016. A mild blue shift was broad, though some bleeding in Lower Bucks stands out. Chester County, at Biden +17, was a bellwether.
I double-checked Lower Oxford, the dark red in southwest Chester. It was Clinton +22 to Biden +2. There's a HBCU there -- Lincoln University -- so I wonder if schools being online impacted that.
Lower Oxford also cast *fewer* votes than 2016 (rare for the area) so that sort of suggests my guess.