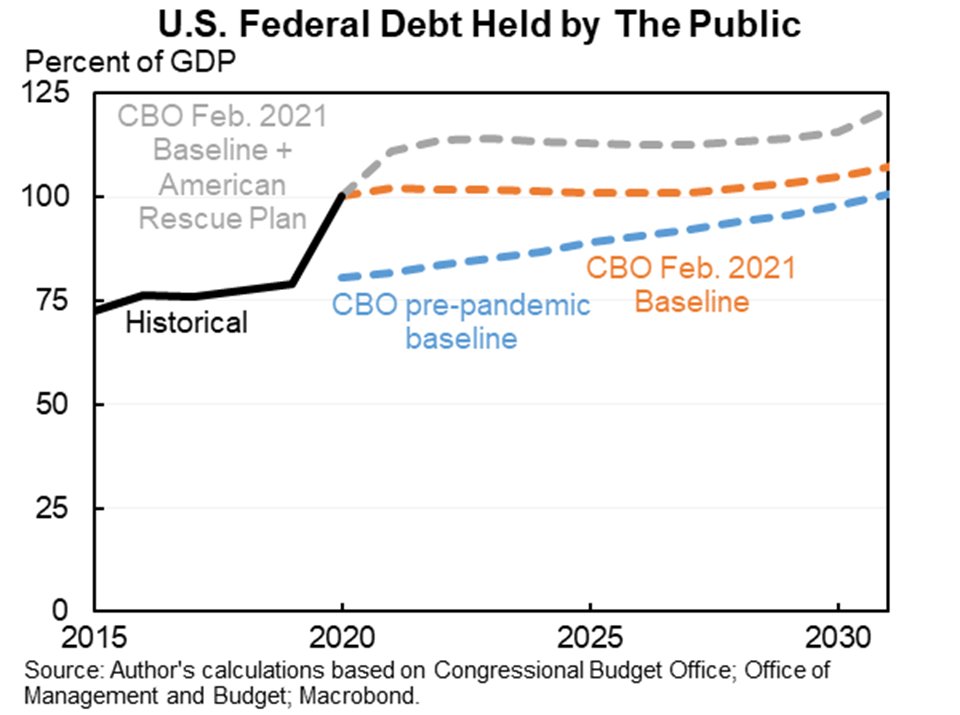
The new @USCBO report confirms that we have substantial fiscal space, in fact more than we've generally had in the past. This is even true if the American Rescue Plan passes in full.
Critical to this is low interest rates mean low debt service.
CBO projects higher debt/GDP than it did pre-pandemic. But even this projection is not "spiraling" within the budget window but a relatively gradual increase.
More importantly, debt/GDP is a bad metric to look at as I've explained before.
CBO has lowered its interest rate forecast more than it raised its debt forecast. So real debt service as a share of GDP is lower than what we expected pre-crisis. This is even true with the American Rescue Plan (and assuming it raises interest rates).
Looked at over a longer period of time real debt service is expected to remain low relative to the economy for at least the next decade. @LHSummers and I suggested a 2% target for this metric, by the end of the decade we are closer to 0.5% even with the American Rescue Plan.
From a purely fiscal perspective, this means that we can afford the additional debt associated with the American Rescue Plan plus substantial additional debt thereafter for Build Back Better.
(There is a separate debate about the best time path and composition of that debt.)
• • •
Missing some Tweet in this thread? You can try to
force a refresh
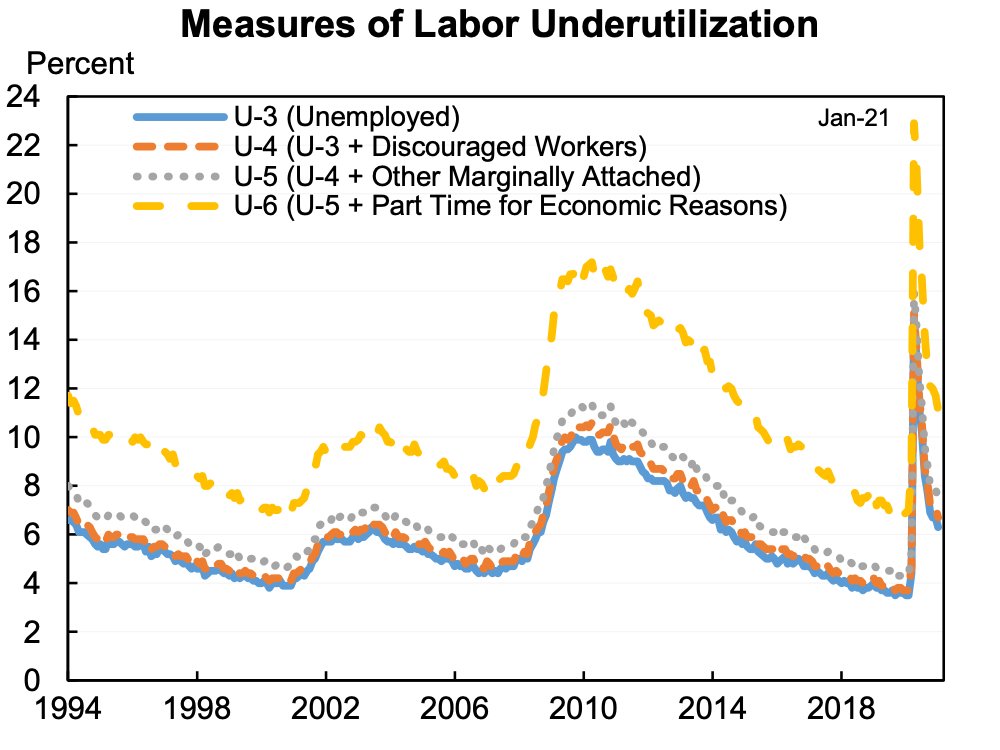
I've gotten questions about whether to emphasize U-6 as the "true unemployment rate". It is currently 11.1%.
I don't because I think the concept doesn't add much, it misses how unusually bad the labor market is now, is analytically flawed, and can be misleading.
Thread:
The official unemployment rate is 6.3%. It is unemployed (people looking for work) divided by the labor force (working or looking for work).
U-6 is 11.1%, it adds in "marginally attached" (discouraged workers & would take a job if it came along) and involuntary part-time.
DOESN'T ADD MUCH. U-6 is one of several alternative unemployment concepts produced monthly by the BLS. They are all useful to look at. But they also all pretty much up and down together so they rarely tell much of a different story.
I thought I would engage with this criticism of my suggestion that the UI/week bump be phased down to $100 or $200/week by late summer/early fall even if I don't love the way this person phrased their disagreement.
--The UI bump is currently slated to be $0 then for late summer/early fall.
--The House Dem proposal calls for reducing the bump to $0 in September.
--IF we had adopted triggers the bump would likely have been well below this by then.
Second, my argument was about supply not demand. To have this much demand and not have overheating we need millions of people getting back into jobs. I believe that can happen. But I also want to give it every chance possible and this policy would be consistent with it.
@chrislhayes raised a question about "overheating" from a thread I did. I want to answer him in a thread with general conceptual points & their current application.
Short version: if there is no risk of overheating we are doing too little.
The chance of overheating with this package is not 0% and not 100%.
Overheating is not costless.
The right sized and designed package should balance the costs/probability of costs against the benefits/probability of benefits.
Framed differently we recognize this when we say "it is better to err on the side of too much instead of too little." That sentence acknowledges the possibility of errors in both directions.
(MMT also says the limiting principle for fiscal policy should be inflation.)
You should never update your beliefs too much based on any one paper. And evidence from 1950-2019 might be more relevant in thinking about July/Aug/Sep 2021 than evidence from 2020 (points @Claudia_Sahm has made in a different context).
If I was updating would say:
Given the excess saving, the larger bank balances that @ProfFionasm and team have documented elsewhere, the $2,000 checks, the unemployed would have pre-pandemic consumption levels even with less than $400/week. jpmorganchase.com/institute/rese…
Jay Powell cited an unemployment rate of 10% adjusted for participation. Willie Powell & I have been using 8.3% as the "realistic unemployment rate". Both are correct, both are useful, I won't be offended if you use his instead of mind, but a technical note on the differences.
The labor force participation rate has fallen from 63.3% in February 2020 to 61.4% in January 2021 as 4.3m people gave up looking for work. Powell's stat is that all 4.3m had not given up but were instead classified as unemployed then the unemployment rate would be 10% now.
The participation rate always falls in recessions so the Powell stat is a great way to capture just how terrible the current labor market is.
The downside of the Powell stat is that you cannot (or at least should not) compare it to historical unemployment rates.