💉VACCINE DATA UPDATE (Feb. 19)💉
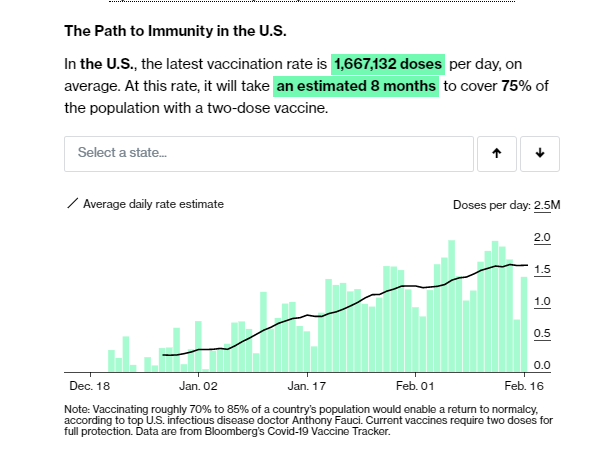
📊1.4M doses today; 7-day avg=1.49M/day
🇺🇸US: 60.5M doses total
❄️⚡️We continue to see BIG impact from the storms.
🧵below on a *major* methodological change at CDC that affects our totals tonight
bloomberg.com/graphics/covid…
📊1.4M doses today; 7-day avg=1.49M/day
🇺🇸US: 60.5M doses total
❄️⚡️We continue to see BIG impact from the storms.
🧵below on a *major* methodological change at CDC that affects our totals tonight
bloomberg.com/graphics/covid…

⚠️First, CDC's method change (this is important)
1/ As of this afternoon, CDC is assigning doses given to people in federal entities TO the states where they reside. This significantly affects the CDC's state totals in a way that makes them harder to compare to state dashboards
1/ As of this afternoon, CDC is assigning doses given to people in federal entities TO the states where they reside. This significantly affects the CDC's state totals in a way that makes them harder to compare to state dashboards
2/ This amounts to about 3 million doses. This makes it much harder for us to compare what states report to what CDC reports, which is a big part of our model. (Federal entity numbers are not typically included in state-reported vaccine tallies.)
3/ 🚨Because of that, we are NOT including CDC's update in tonight's report. This artificially depresses the overall number today, which would be higher IF we had an accurate apples-to-apples comparison.
4/ Our general preference is to be conservative when we need further clarity on a number or report. We worried that there was high risk of data errors and over-count if we included the figures tonight, and we're working to figure out how we resolve this as quickly as possible.
5/ Summary: The numbers seem low. They're actually higher, but there's data confusion we need to resolve to show that. We didn't want to break/mis-report something. Bear with us.
❄️SNOW TIME⚡️
So how bad is the impact of the winter storms on vaccinations? It's significant. Twice this week, Texas cut its number of reported vaccinations by 110,000 doses, more than an 80% haircut.
Blog post on Texas here: bloomberg.com/news/live-blog…
So how bad is the impact of the winter storms on vaccinations? It's significant. Twice this week, Texas cut its number of reported vaccinations by 110,000 doses, more than an 80% haircut.
Blog post on Texas here: bloomberg.com/news/live-blog…
Here's a chart from earlier today showing the hit to the Texas totals -- it's enough to bend the broader U.S. rate curve downward:

🚀And, finally, I wrote yesterday about how more vaccine doses are on the way. Today Pfizer confirmed parts of our model -- they're ramping up deliveries.
https://twitter.com/ArmstrongDrew/status/1362893440309202944?s=20
☝️Actual last thing. CDC may make *another* methodological change tonight that will have a significant impact on state numbers. So, buckle up.
• • •
Missing some Tweet in this thread? You can try to
force a refresh