Just updating the deviation graphs that I posted a few days ago: no major changes in trend, but good to see the cases in 75-79s continuing to head strongly downward under the influence of the vaccine, following the 80+: (short thread)
(to be clear on method, these figures are the cases in each age group expressed as a % of the total, and then indexed to 100% on 25th Jan so that we can see the deviation in each group on the same scale) 2/n
here's the chart for each of the subgroups within the 80+, you can see the 85-89s falling furthest, but the 90+ now working to catch up. 3/n
one of the puzzles over the last few weeks has been trying to explain the behaviour of that 90+ group: they were the first to start being vaccinated, but it took a long while for this to become visible in the case data. 4/n
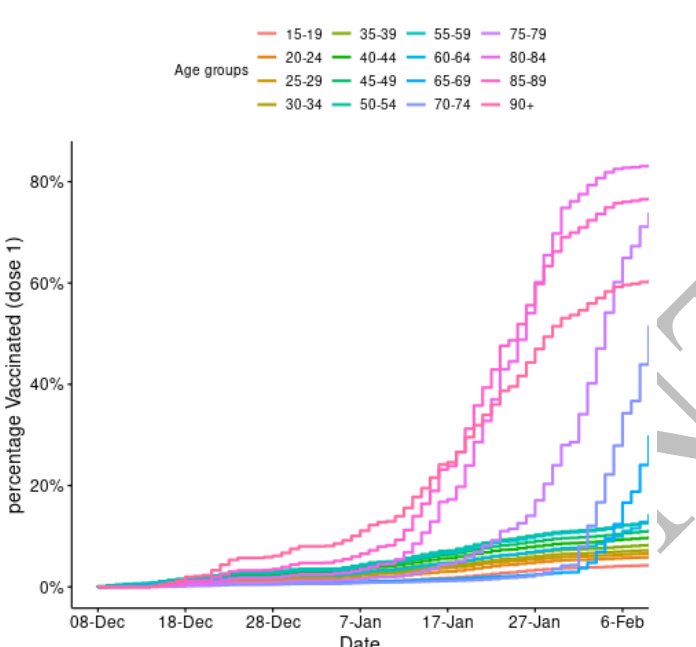
it could have something to do with this pattern which is from the Public Health Scotland data released yesterday (h/t @petesivey for spotting it) - 90+ started first but took a long time to complete. I don't know if England was similar, but if so it could help explain 5/n
alternatively, it may be that my theory that "lockdown works less well for the 80+" is just even more true for the 90+ because they are more reliant on care/support so can't lock down to the same extent. this would mean that we'd expect their case rates as a % of the total 6/n
to *rise* during lockdown. so the vaccine had a big hill to climb, to counter-act that effect, before it could start to show falling cases as a % of the total. it took a while to do it, and now we're starting to see the result. [or it could be a bit of both]. /end

• • •

Missing some Tweet in this thread? You can try to force a refresh
 

Keep Current with James Ward

James Ward Profile picture

Stay in touch and get notified when new unrolls are available from this author!

Read all threads

This Thread may be Removed Anytime!

PDF

Twitter may remove this content at anytime! Save it as PDF for later use!

Try unrolling a thread yourself!

how to unroll video
  1. Follow @ThreadReaderApp to mention us!

  2. From a Twitter thread mention us with a keyword "unroll"
@threadreaderapp unroll

Practice here first or read more on our help page!

More from @JamesWard73

24 Feb
Since I updated my “vaccination & release” model last weekend, many people have asked me why it predicts a possible 4th wave, when so many people have already caught covid, or will have been vaccinated. To answer this it may be helpful to look at this chart: (thread) Image
This shows the proportion of the UK population that is immune either by having had covid (blue area), or by having been vaccinated (grey area, on top). In my model, the blue zone starts around 20% on Jan 1st (note this includes 2% who are infected with covid at that point) 2/n
This then grows to around 25% by the end of February, and stays flat around that level (i.e. not very many infections happening) until we remove the final set of controls in late June – note this is following the plan announced by Boris on Monday. 3/n
Read 25 tweets
23 Feb
Now the kids are in bed, I can focus on updating my model to deal with the many events of today. These include 1) Boris’s plan 2) recent case trends 3) news on vaccine effectiveness vs. serious disease, and vs. transmission. Results below: mostly good news. (thread)
1) Boris’s plan is not very different from some other scenarios we have already looked at – and just a few weeks slower to unlock than our base case. Regular readers will be able to predict that it pushes the “4th wave” peak into the autumn – but no real change to outcomes.
Note I’ve assumed that the final unlocking on June 21 goes into a “near normal” state with some continuing social-distancing requirements e.g. masks in crowded spaces, limits on large indoor events, ongoing WFH etc. – which lasts until 31 Dec.
Read 16 tweets
21 Feb
Thank you for all the replies to my thread yesterday on the exit strategy from lockdown – lots of positive and constructive comments, and a few helpful suggestions for additional scenarios or varied assumptions. I’ve done some of the easy ones: (thread)
1)Higher vaccine effectiveness vs. hospitalisation and transmission, responding to the most recent Pfizer data from Israel
2)Lower vaccine take-up in the under-50s / non-vulnerable group
3)Higher starting immunity
4)Stronger seasonality effect
Please note that our starting point for all these sensitivities is my controlled scenario with a moderate “fourth wave” in the summer, based on an opening to near-normality at the end of May. (and yes, I know seasonality might squash that wave – we’ll come to that). Image
Read 20 tweets
21 Feb
OK, I think I’m ready to call this as a new trend in the 75-79s (cases as a % of total, for England). The timing fits for this to be a vaccine effect; we know vaccination of this group started in earnest from 25th Jan (although some may have had it slightly before then) 1/5 Image
and the deviation is from 9th Feb i.e. 15 days later. Data from Phase 3 trials and from Israel was suggesting a delay of 14-19 days, perhaps longer in the older age groups. This is the link showing over-70s started booking from Monday 25th Jan: bbc.co.uk/news/uk-556981… 2/5
And this NHS data shows that 83% of 75-79yos were vaccinated by Sunday 31st Jan – so we should be getting the full effect of that over the next few days of data. england.nhs.uk/statistics/wp-…
Read 6 tweets
20 Feb
Since the question of how far, and how fast, we can relax our current lockdown restrictions is very much current, I have updated my “vax & release” model with the latest data. And it’s mostly good news: we should be able to unlock faster than I previously thought, 1/8
returning to near-normality in June, without causing the many tens or hundreds of thousands of further deaths that were predicted by the Warwick and Imperial models. (I’m sure their modelling is much better than mine – it's just their assumptions are out-of-date). 2/8
However, there is a sting in the tail: there is still a strong risk of a further (fourth) wave in the summer or autumn, with maybe another ~20-30k deaths. To avoid that wave causing a peak of hospitalisations that would overwhelm the NHS, it may be necessary to continue 3/8
Read 9 tweets
31 Jan
I've had a lot of positive comments on this theory, and some helpful challenges. The most common of which was: surely a single-day effect wouldn't be big enough to cause the 'twist' in the data that we're seeing in those age groups? So I set out to find out if it was (thread)
This is one of those university / job interview 'order of magnitude' estimation problems. So feel free to disagree with any or all steps on my logic chain, and please explain why - it will help improve / refine (or falsify) the analysis.
So let's focus on the primary-school-age kids as that's where the effect is strongest. We have 3.5m 5-9 year-olds in England. I don't know how many were in school on 4th Jan - we know some regions (London / Kent etc.) didn't go back, and a lot of schools had INSET days etc
Read 19 tweets

Did Thread Reader help you today?

Support us! We are indie developers!


This site is made by just two indie developers on a laptop doing marketing, support and development! Read more about the story.

Become a Premium Member ($3/month or $30/year) and get exclusive features!

Become Premium

Too expensive? Make a small donation by buying us coffee ($5) or help with server cost ($10)

Donate via Paypal Become our Patreon

Thank you for your support!

Follow Us on Twitter!