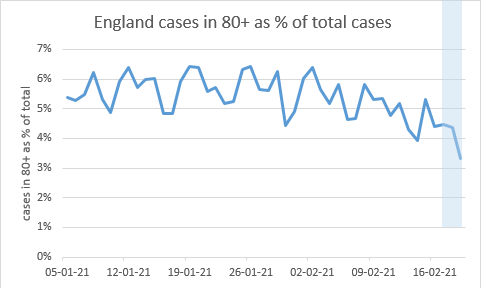
OK, I think I’m ready to call this as a new trend in the 75-79s (cases as a % of total, for England). The timing fits for this to be a vaccine effect; we know vaccination of this group started in earnest from 25th Jan (although some may have had it slightly before then) 1/5
and the deviation is from 9th Feb i.e. 15 days later. Data from Phase 3 trials and from Israel was suggesting a delay of 14-19 days, perhaps longer in the older age groups. This is the link showing over-70s started booking from Monday 25th Jan: bbc.co.uk/news/uk-556981… 2/5
And this NHS data shows that 83% of 75-79yos were vaccinated by Sunday 31st Jan – so we should be getting the full effect of that over the next few days of data. england.nhs.uk/statistics/wp-…
The effect isn’t as clear yet in the 70-74yos, but that’s not surprising because only 35% of them had been vaccinated by 31st Jan– it looks like most areas went down the age categories in strict order. So we’d be looking for this to move more strongly in the next week. 4/5
And here’s our old friend the over-80s, continuing its gentle track downwards. (please note as always, data in the blue zone is unreliable / incomplete / subject to revisions) 5/5
Just updating the deviation graphs that I posted a few days ago: no major changes in trend, but good to see the cases in 75-79s continuing to head strongly downward under the influence of the vaccine, following the 80+: (short thread)
(to be clear on method, these figures are the cases in each age group expressed as a % of the total, and then indexed to 100% on 25th Jan so that we can see the deviation in each group on the same scale) 2/n
here's the chart for each of the subgroups within the 80+, you can see the 85-89s falling furthest, but the 90+ now working to catch up. 3/n
Now the kids are in bed, I can focus on updating my model to deal with the many events of today. These include 1) Boris’s plan 2) recent case trends 3) news on vaccine effectiveness vs. serious disease, and vs. transmission. Results below: mostly good news. (thread)
1) Boris’s plan is not very different from some other scenarios we have already looked at – and just a few weeks slower to unlock than our base case. Regular readers will be able to predict that it pushes the “4th wave” peak into the autumn – but no real change to outcomes.
Note I’ve assumed that the final unlocking on June 21 goes into a “near normal” state with some continuing social-distancing requirements e.g. masks in crowded spaces, limits on large indoor events, ongoing WFH etc. – which lasts until 31 Dec.
Thank you for all the replies to my thread yesterday on the exit strategy from lockdown – lots of positive and constructive comments, and a few helpful suggestions for additional scenarios or varied assumptions. I’ve done some of the easy ones: (thread)
1)Higher vaccine effectiveness vs. hospitalisation and transmission, responding to the most recent Pfizer data from Israel
2)Lower vaccine take-up in the under-50s / non-vulnerable group
3)Higher starting immunity
4)Stronger seasonality effect
Please note that our starting point for all these sensitivities is my controlled scenario with a moderate “fourth wave” in the summer, based on an opening to near-normality at the end of May. (and yes, I know seasonality might squash that wave – we’ll come to that).
Since the question of how far, and how fast, we can relax our current lockdown restrictions is very much current, I have updated my “vax & release” model with the latest data. And it’s mostly good news: we should be able to unlock faster than I previously thought, 1/8
returning to near-normality in June, without causing the many tens or hundreds of thousands of further deaths that were predicted by the Warwick and Imperial models. (I’m sure their modelling is much better than mine – it's just their assumptions are out-of-date). 2/8
However, there is a sting in the tail: there is still a strong risk of a further (fourth) wave in the summer or autumn, with maybe another ~20-30k deaths. To avoid that wave causing a peak of hospitalisations that would overwhelm the NHS, it may be necessary to continue 3/8
I've had a lot of positive comments on this theory, and some helpful challenges. The most common of which was: surely a single-day effect wouldn't be big enough to cause the 'twist' in the data that we're seeing in those age groups? So I set out to find out if it was (thread)
This is one of those university / job interview 'order of magnitude' estimation problems. So feel free to disagree with any or all steps on my logic chain, and please explain why - it will help improve / refine (or falsify) the analysis.
So let's focus on the primary-school-age kids as that's where the effect is strongest. We have 3.5m 5-9 year-olds in England. I don't know how many were in school on 4th Jan - we know some regions (London / Kent etc.) didn't go back, and a lot of schools had INSET days etc
I have updated my analysis of potential vaccine effects in over-80s cases with today’s latest dashboard data. I am increasingly confident that this does show an actual impact of vaccines, for the following reasons: (THREAD)
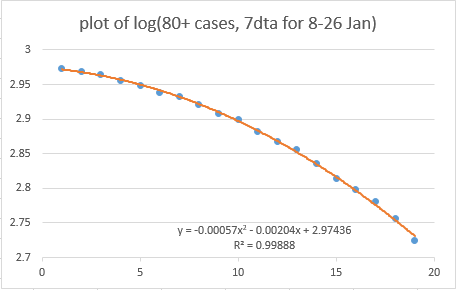
1) The trend is continuing to follow a clear quadratic curve, as per @BristOliver's prediction
2) The implied rate of rate of protection from that curve matches almost exactly with the NHS vaccination data, if you assume a 2-week lag to protection, and a 50% rate of protection from the first dose: both come to ~0.6% of the over-80s age group getting protection per day