Model Update Klaxon: the good thing about publishing model results is that everyone tells me why they think the model is wrong – mostly constructively, and quite often I agree with them. So I’ve changed a few things, and it’s really good news. (thread)
Most of the updates today are to do with children, which hasn’t been a big focus of my modelling, as I was much more worried about what was going on with the over-50s. But it’s starting to become more relevant as we begin to ‘flirt’ with the herd immunity threshold (HIT). 3/n
Before we go there: there was near-universal consensus in the replies, including from some people whose judgement I know and trust, that I have my starting level of immunity on 4th Jan 2021 (at 18%, plus 2% infected) slightly too low 4/n
So without any great science, I’ve nudged this up by 5%, so it now starts at 23% plus 2% infected, or 25% in total. That could still be wrong (either way), but at least it feels more central in the range of believable values now. 5/n
Unfortunately it doesn’t make as much difference to the “plateau” level of immunity as you might think: after vaccination, we’re at 64% (instead of 62% previously). So we’re still a little way short of the HIT, and the model still predicts a (slightly smaller) fourth wave. 6/n
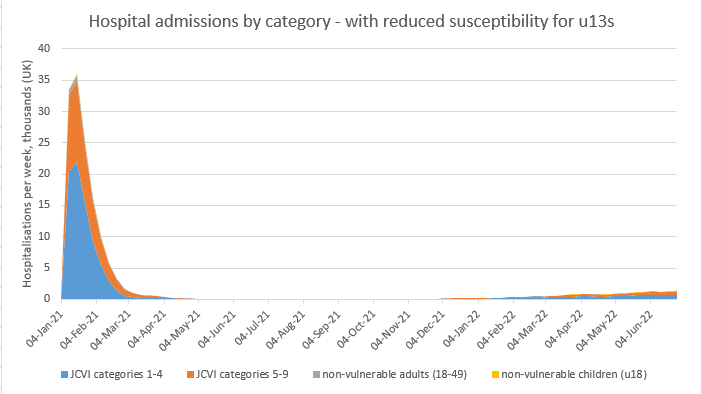
Now to the kids: there is good evidence that children (and particularly, pre-teenage children) are, on the whole, less susceptible to catching and passing on covid. At the moment my model doesn’t account for this, they’re just treated the same as adults. 7/n
So I’ve introduced an assumption that under-13s are 60% less susceptible to covid; this is equivalent to a susceptibility reduction of 45% for all under-18s, which I think is consistent with the literature (but happy to be corrected). 8/n
With this assumption, we get our immunity levels up to 68% after vaccinations are done, which is tantalisingly close to the HIT, and we have a very tiny fourth wave emerging in 2022: 9/n
Could we do any better? Well, we know that safety trials are underway for vaccines in children – for example nihr.ac.uk/news/first-chi… (and similar ones for Pfizer and Moderna). So, assuming good results, we could vaccinate them too. 10/n
Given what we know about susceptibility, I think it’s more likely we would start with teenagers, and that’s where most of the benefit is. So I’ve assumed a first dose in June/July, and a second dose in Sept/Oct, for all 13-17 year olds who want it – with a take-up of 70% 11/n
Does that get us over the line? Well, still not quite, but post-vaccination immunity is over 70%, within spitting distance of the HIT, and with that level of immunity in the population there’s really no prospect of a material fourth wave. 12/n
So that’s really good news, then? Well, yes, it’s the first time that my model’s central case has predicted no fourth wave – so worth celebrating. But I wouldn’t be a corona centrist if I didn’t take this opportunity to remind you of a few things that could still go wrong: 13/n
To start with, there’s still quite a lot of uncertain variables here: I might have my starting value for R0 too low, or my assumptions on vaccine take-up in the under-50s, and effectiveness vs. transmission after 2 doses of AZ, too high. 14/n
Secondly, as we look over longer timescales, it becomes more relevant to think about how immunity might change (and, probably, reduce) over time. And of course we could get variants that partially ‘escape’ the transmission immunity we’ve built up. 15/n
And finally, as we’ve noted before, covid risks are not spread uniformly across the UK. If at a national level we’re poised precariously on the HIT, that means that in some areas we’ll be above it, and some below. So in reality, … 16/n
while there might not be a significant national fourth wave, it’s still likely that there would be regional or local outbreaks in those areas that have higher natural R0 (e.g. due to deprivation / population density), lower vaccine take-up, or lower infection-based immunity. 17/n
So there’s still lots of things that could cause us problems in the next few months, but I’m increasingly confident that we’re on a track to beating this, and restoring something like normality in the summer. And that’s my happy thought for today. /end

• • •

Missing some Tweet in this thread? You can try to force a refresh
 

Keep Current with James Ward

James Ward Profile picture

Stay in touch and get notified when new unrolls are available from this author!

Read all threads

This Thread may be Removed Anytime!

PDF

Twitter may remove this content at anytime! Save it as PDF for later use!

Try unrolling a thread yourself!

how to unroll video
  1. Follow @ThreadReaderApp to mention us!

  2. From a Twitter thread mention us with a keyword "unroll"
@threadreaderapp unroll

Practice here first or read more on our help page!

More from @JamesWard73

25 Feb
Although they don't change much day-to-day, I never get bored looking at these charts, because of the positive message behind them. and is that the first sign of the 70-74 line accelerating downwards? (just at the right time, 3 weeks after the peak vaccinations started) 1/n
and here's more boring data, with the sub-groups of 80+ all now consistently showing case rates (as a % of the all-ages total) >25% lower than they were in late January 2/n
some have asked me: why is the deviation not larger, when we know (from PHE/PHS published data) that the vaccines are more than 25% effective, and take-up has been nearly 100% in these age groups? And I think the answer is: 3/n
Read 5 tweets
24 Feb
Since I updated my “vaccination & release” model last weekend, many people have asked me why it predicts a possible 4th wave, when so many people have already caught covid, or will have been vaccinated. To answer this it may be helpful to look at this chart: (thread)
This shows the proportion of the UK population that is immune either by having had covid (blue area), or by having been vaccinated (grey area, on top). In my model, the blue zone starts around 20% on Jan 1st (note this includes 2% who are infected with covid at that point) 2/n
This then grows to around 25% by the end of February, and stays flat around that level (i.e. not very many infections happening) until we remove the final set of controls in late June – note this is following the plan announced by Boris on Monday. 3/n
Read 25 tweets
23 Feb
Just updating the deviation graphs that I posted a few days ago: no major changes in trend, but good to see the cases in 75-79s continuing to head strongly downward under the influence of the vaccine, following the 80+: (short thread)
(to be clear on method, these figures are the cases in each age group expressed as a % of the total, and then indexed to 100% on 25th Jan so that we can see the deviation in each group on the same scale) 2/n
here's the chart for each of the subgroups within the 80+, you can see the 85-89s falling furthest, but the 90+ now working to catch up. 3/n
Read 7 tweets
23 Feb
Now the kids are in bed, I can focus on updating my model to deal with the many events of today. These include 1) Boris’s plan 2) recent case trends 3) news on vaccine effectiveness vs. serious disease, and vs. transmission. Results below: mostly good news. (thread)
1) Boris’s plan is not very different from some other scenarios we have already looked at – and just a few weeks slower to unlock than our base case. Regular readers will be able to predict that it pushes the “4th wave” peak into the autumn – but no real change to outcomes.
Note I’ve assumed that the final unlocking on June 21 goes into a “near normal” state with some continuing social-distancing requirements e.g. masks in crowded spaces, limits on large indoor events, ongoing WFH etc. – which lasts until 31 Dec.
Read 16 tweets
21 Feb
Thank you for all the replies to my thread yesterday on the exit strategy from lockdown – lots of positive and constructive comments, and a few helpful suggestions for additional scenarios or varied assumptions. I’ve done some of the easy ones: (thread)
1)Higher vaccine effectiveness vs. hospitalisation and transmission, responding to the most recent Pfizer data from Israel
2)Lower vaccine take-up in the under-50s / non-vulnerable group
3)Higher starting immunity
4)Stronger seasonality effect
Please note that our starting point for all these sensitivities is my controlled scenario with a moderate “fourth wave” in the summer, based on an opening to near-normality at the end of May. (and yes, I know seasonality might squash that wave – we’ll come to that). Image
Read 20 tweets
21 Feb
OK, I think I’m ready to call this as a new trend in the 75-79s (cases as a % of total, for England). The timing fits for this to be a vaccine effect; we know vaccination of this group started in earnest from 25th Jan (although some may have had it slightly before then) 1/5 Image
and the deviation is from 9th Feb i.e. 15 days later. Data from Phase 3 trials and from Israel was suggesting a delay of 14-19 days, perhaps longer in the older age groups. This is the link showing over-70s started booking from Monday 25th Jan: bbc.co.uk/news/uk-556981… 2/5
And this NHS data shows that 83% of 75-79yos were vaccinated by Sunday 31st Jan – so we should be getting the full effect of that over the next few days of data. england.nhs.uk/statistics/wp-…
Read 6 tweets

Did Thread Reader help you today?

Support us! We are indie developers!


This site is made by just two indie developers on a laptop doing marketing, support and development! Read more about the story.

Become a Premium Member ($3/month or $30/year) and get exclusive features!

Become Premium

Too expensive? Make a small donation by buying us coffee ($5) or help with server cost ($10)

Donate via Paypal Become our Patreon

Thank you for your support!

Follow Us on Twitter!