How unrealistic are the scenarios underpinning the US "social cost of carbon" estimates?

Very

Figure below compares average cumulative CO2 emissions to 2300 assumed in US SCC scenarios with hypothetical net-zero scenarios for 2100 and 2200

Read more: rogerpielkejr.substack.com/p/the-biden-ad…
Interesting/Odd

Research highlighted by US gov't to serve as basis for new SCC estimates all comes from just one group -- the Climate Impacts Lab

Left panel - IWG figure
Right panel - Original
It is interesting and odd because the Climate Impact Lab is a spin-off of a Steyer-Bloomberg-Paulson funded effort that really launched RCP8.5 into a more prominent position in science and policy

Details--> forbes.com/sites/rogerpie…
The story of the SCC is just a small part of a larger story about the unstoppable momentum of outdated science

rogerpielkejr.substack.com/p/the-unstoppa…
If you would like a more granular and technical history of the story of implausible scenarios, please see this paper -->doi.org/10.1016/j.erss…

Email or DM for a copy if you don't have access

• • •

Missing some Tweet in this thread? You can try to force a refresh
 

Keep Current with Roger Pielke Jr.

Roger Pielke Jr. Profile picture

Stay in touch and get notified when new unrolls are available from this author!

Read all threads

This Thread may be Removed Anytime!

PDF

Twitter may remove this content at anytime! Save it as PDF for later use!

Try unrolling a thread yourself!

how to unroll video
  1. Follow @ThreadReaderApp to mention us!

  2. From a Twitter thread mention us with a keyword "unroll"
@threadreaderapp unroll

Practice here first or read more on our help page!

More from @RogerPielkeJr

1 Mar
🧵Some technical details following my post on the SCC

Here are cumulative CO2 emissions (FFI) to 2300 for each of the 5 USG scenarios (4 are BAU & 1 is policy), along with the extended RCP8.5 & 2 net-zero scenarios (for 2100 and 2200)

Let me emphasize how ridiculous this is🤡 Image
Looking at the high (USG2) and low (USG5) scenarios gives a 2300 temperature increase of as much as >9 degrees C

I have annotated the figure with the red line indicating 3 deg C which occurs as early as ~2070 under USG2 Image
Ok, now let's look at the IAM damage functions
Here I have annotated the figure by adding the red line denoting 3 deg C

Note that the vast majority of damage occurs >3 deg C (& up to 3C is ~0 +/-) Image
Read 6 tweets
21 Feb
There are many important lessons to be learned from the Texas blackout

But this event is not about increasing extremes, nor about an unstable climate, nor breaking the bounds of predictability

Not everything that happens is about climate change

nytimes.com/2021/02/20/cli…
I’m thinking that “climate deniers” should also refer to people who deny variability in climate

As “climate” has evolved to mean a cause of events we have lost its true meaning, the statistics of weather over decades and longer

And those statistics vary on all timescales
The Texas story is NOT that infrastructure built for a past climate is suddenly out of its zone

It’s that the infrastructure built for documented climate variability is not fit for purpose

Blaming climate change is both wrong & ignores the real culprit: poor decision making
Read 6 tweets
17 Feb
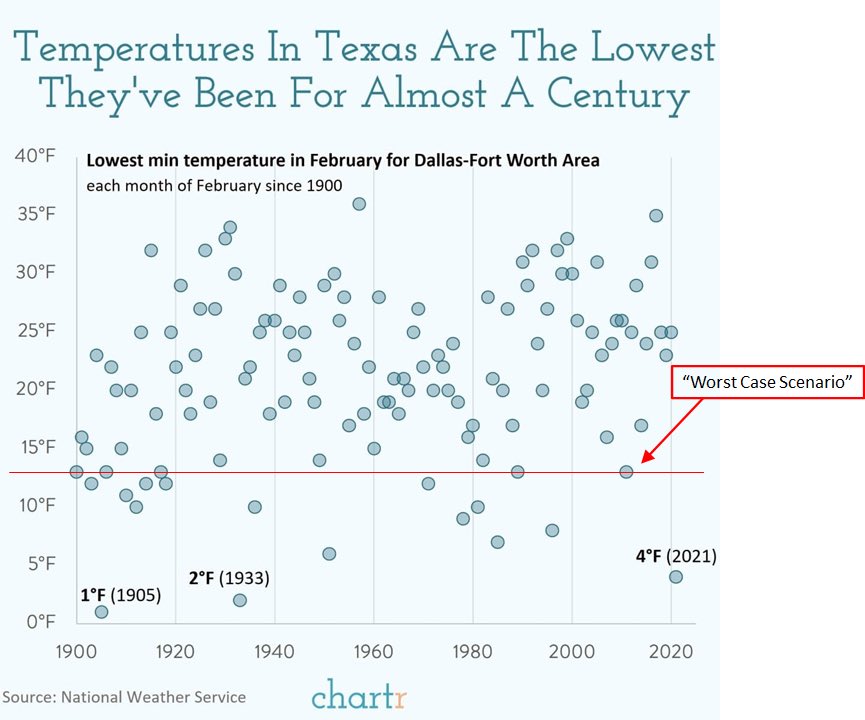
🧵Short thread on Texas weather, climate and robust decision making

NY Times @bradplumer reports what the "worst case" planning scenario was by ERCOT for winter 2020/21
nytimes.com/2021/02/16/cli…

But was it really a "worst case"?
Far from it ...
The 67MW "worst case" comes from using 2011 winter as an analogue
Source: ercot.com/news/releases/…
Where does 2011 sit in terms of recent history?
EIA has heating degree days for "West South Central" US (TX, OK, AR, LA)
Turns out 2011 ranks 24th most HDD for the region since 1973
2011 was not a "worst case" -- not even close
Source: eia.gov/energyexplaine…
Read 6 tweets
17 Feb
🧵I took a look at the recent AIR report on hurricanes and climate change. A few fatal flaws, unfortunately.
Fatal flaw 1
RCP8.5 as BAU
Fatal flaw 2
AIR cites GFDL CMIP5/RCP4.5 to justify projected 35% increase in Cat 4/5 by 2050 doi.org/10.1175/JCLI-D…

But GFDL actually says 35% increase in Cat 4/5 hurr days, not frequency w/ only increase in freq is in NE Pacific & globally -18% total hurricanes (table below)
Read 4 tweets
12 Feb
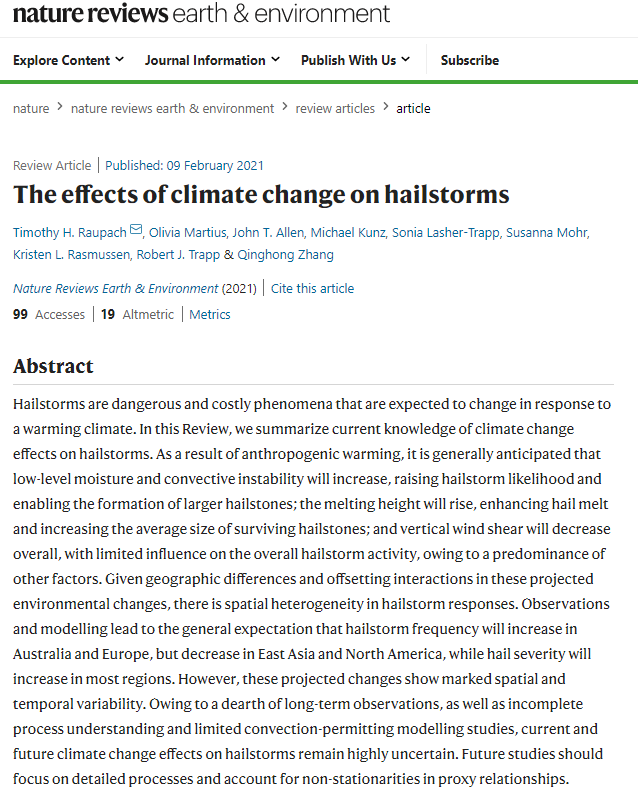
🧵 on new paper:
Raupach et al 2021 on climate change and hailstorms
nature.com/articles/s4301…
Summary of trends in hail-prone regions around the world
TL;DR = no up trends, some down
Very cool figure on global hail probability
Read 4 tweets
11 Feb
🧵Good news and bad news on the Biden Administration's efforts to consider a "social cost of carbon" via an Interagency Working Group on the Social Cost of Greenhouse Gases
whitehouse.gov/briefing-room/…
Good news
The IWG is (apparently, for now) employing a methodology that does not use the RCPs or SSPs
nap.edu/catalog/24651/…
Bad news
The methodology of the IWG employs scenarios that are more out-of-date than the RCPs/SSPs -- selected from the EMF-22 scenarios
nap.edu/catalog/24651/…
Read 8 tweets

Did Thread Reader help you today?

Support us! We are indie developers!


This site is made by just two indie developers on a laptop doing marketing, support and development! Read more about the story.

Become a Premium Member ($3/month or $30/year) and get exclusive features!

Become Premium

Too expensive? Make a small donation by buying us coffee ($5) or help with server cost ($10)

Donate via Paypal Become our Patreon

Thank you for your support!

Follow Us on Twitter!