@stellensatz @shekhar_mande @Ashutos61 @Sandeep_1966 Covid infections are picking up in India again. Interestingly, only a few states are contributing to this spike. Why is this happening? Our model SUTRA provides some clues. 1/n
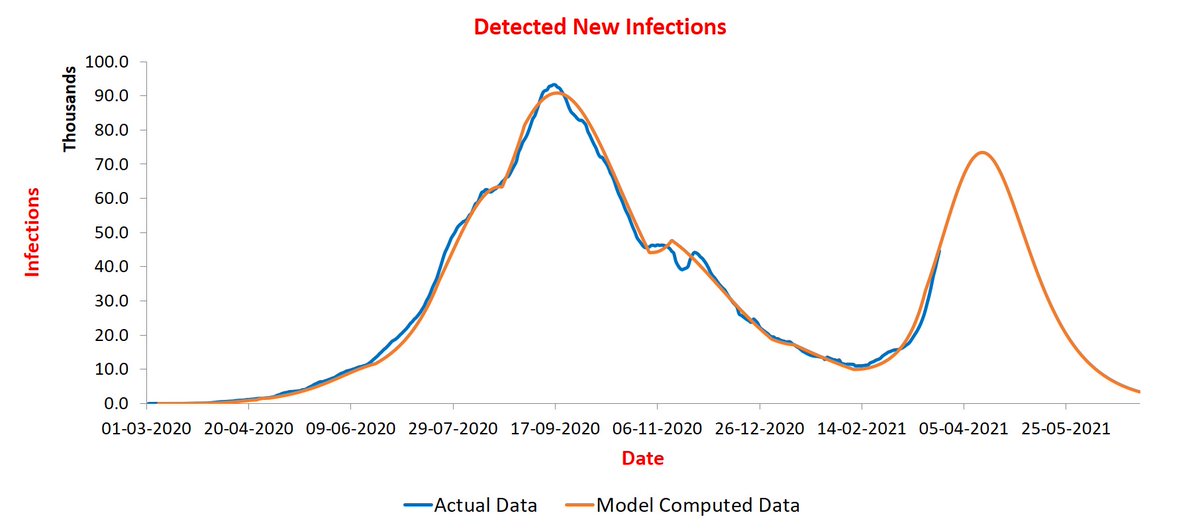
First, let us look at Maharashtra. In the picture, blue curve is recorded daily new infections (averaged over a window of seven days) and orange curve is prediction of the model. According to the model, the latest spike is due to significant increase in contact rate. 2/n Image
Contact rate represents average number of people infected by an infected person in one day. For Maharashtra, it went from 0.3 to 0.5. The peak should arrive within two weeks. 3/n
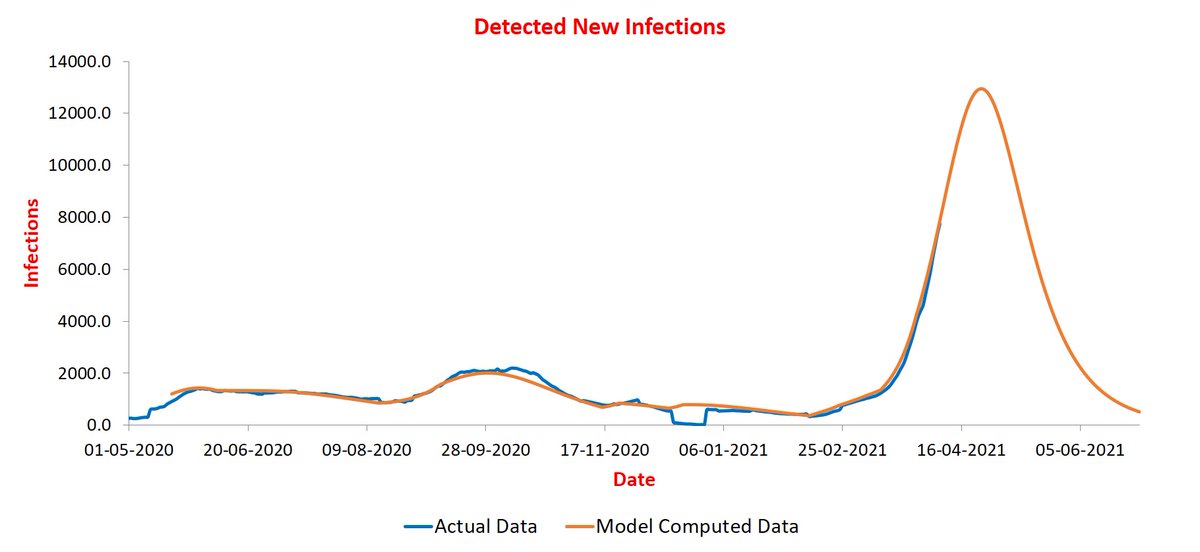
Second state we analyze is Punjab. It has a peak due in March-end at around 2K infections. There are two causes for this: one, contact rate increased from 0.3 to 0.4, and two, reach increased by about 20%. 4/n Image
Reach parameter measures fraction of population under coverage of pandemic. This parameter is monotonically increasing. Once it stabilizes for a long period, we can assume the reach to be close to 100%. 5/n
Major states where reach has stabilized are UP and Bihar. UP in fact has all parameters stable since November. That is why there is no spike in UP. 6/n Image
Bihar has a similar story. Reach is stable since October. Contact rate is fluctuating a bit, but not enough to create a spike. 7/n Image
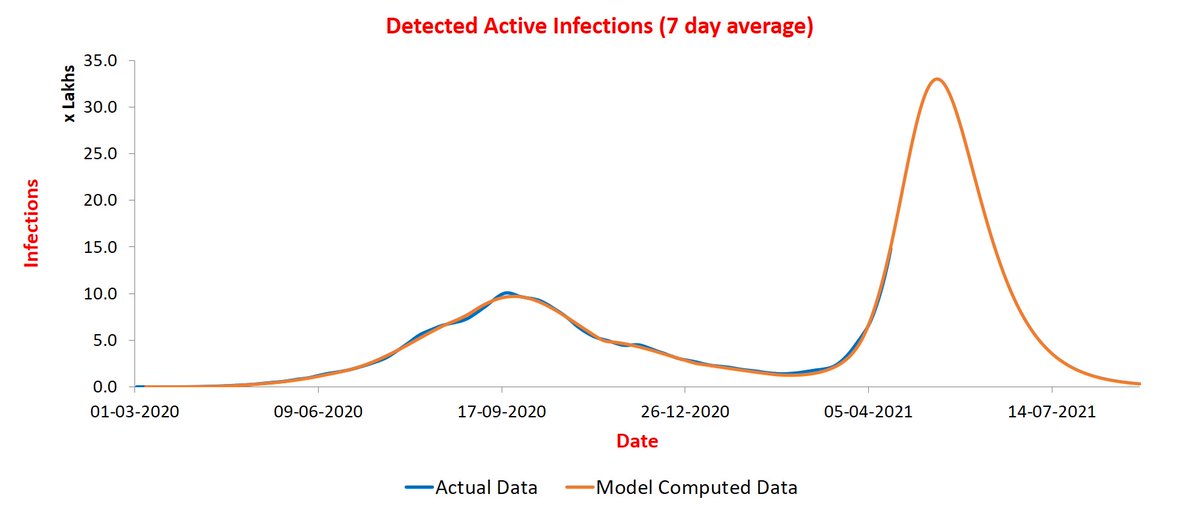
Looking at India, we see a gentle increase until early April followed by equally gentle decline. Reach for India is almost stable since September - it has increased by less than 7% since. The current increase is caused by increase in contact rate to 0.3 from 0.22. 8/n Image
Above shows there will be no "second wave" in India. The states should be able to tide over the spikes without much problems. 9/9

• • •

Missing some Tweet in this thread? You can try to force a refresh
 

Keep Current with Manindra Agrawal

Manindra Agrawal Profile picture

Stay in touch and get notified when new unrolls are available from this author!

Read all threads

This Thread may be Removed Anytime!

PDF

Twitter may remove this content at anytime! Save it as PDF for later use!

Try unrolling a thread yourself!

how to unroll video
  1. Follow @ThreadReaderApp to mention us!

  2. From a Twitter thread mention us with a keyword "unroll"
@threadreaderapp unroll

Practice here first or read more on our help page!

More from @agrawalmanindra

23 Apr
I have been asked by many people about details of the SUTRA model. We have a preprint uploaded at arxiv.org/abs/2101.09158. It describes how we compute parameter values and phase changes.
India projections can be found in this thread:
Read 4 tweets
18 Apr
@stellensatz @Ashutos61 @Sandeep_1966 @shekhar_mande Starting a new thread for India. I updated India curve last on 14th with suggested peak at ~190K. Past few days have breached this value massively. This led to a discussion amongst us (me, Prof Sagar, and Gen Kanitkar).
The problem is that parameters of our model for current phase are continuously drifting, and so it is hard to get their value right. We decided to switch to predicting "active" instead of "new" infections. Former is about 10x of latter and hence less prone to fluctuations.
Indeed, it turned out that the trajectories are better matched. See plot below for the entire timeline.
Read 8 tweets
8 Apr
@stellensatz @Sandeep_1966 @Ashutos61 @shekhar_mande Starting a separate thread on district level predictions. The predicted trajectories do not match as well as for states because of smaller population.
Let us start with Pune -- it was earlier posted on thread on states. It remains on track to peak during April 12-15 at around 11.5K infections/day. Image
Next Mumbai where infections are increasing quite fast. The rise will continue for another couple of weeks and likely to peak during Apr 21-25 at around 13K infections/day. Image
Read 29 tweets
25 Mar
@stellensatz @Ashutos61 @Sandeep_1966 @shekhar_mande This pandemic has a way of embarrassing those making predictions😀. We are indeed in the midst of second wave now. Of course, this wave is being driven primarily by Maharashtra. 1/n
We had to wait for a couple of weeks for the new trajectory to stabilize. Here is what we found: the spike observed in many states is primarily due to a significant increase in contact rate (parameter beta). This parameter determines how fast the pandemic is spreading. 2/n
Consider India. Contact rate has doubled in March (0.24 to 0.48). This results in plot below. The peak is expected to arrive in mid-April at between 70-80K new infections per day. 3/n Image
Read 143 tweets
16 Dec 20
This article appeared today in Print: theprint.in/health/india-i…. The reporter had called me in the afternoon and asked some questions about our model. I explained to her the conclusions including the fact that a large number of infected people in India showed few symptoms. 1/n
To highlight this point, I mentioned that, according to our model, only one in 90 cases have been reported. And the unreported ones are primarily due to being asymptomatic. However, this ratio is not uniform across regions. 2/n
In Delhi it is around 1:25 while in UP/Bihar it climbs up to around 1:300. Unfortunately, the report has spun this in a different direction. The unreported cases become "missing ones". The implication being that our system has somehow goofed up by not detecting them. 3 /n
Read 9 tweets

Did Thread Reader help you today?

Support us! We are indie developers!


This site is made by just two indie developers on a laptop doing marketing, support and development! Read more about the story.

Become a Premium Member ($3/month or $30/year) and get exclusive features!

Become Premium

Too expensive? Make a small donation by buying us coffee ($5) or help with server cost ($10)

Donate via Paypal Become our Patreon

Thank you for your support!

Follow Us on Twitter!