#COVID19 UPDATE THREAD – MARCH 14
All graphics are 7-day averages. Today’s raw reporting for each metric is in the tweet below.
(Data retrieved directly from state dashboards. Not every state updates its numbers daily.)
UNITED STATES
All graphics are 7-day averages. Today’s raw reporting for each metric is in the tweet below.
(Data retrieved directly from state dashboards. Not every state updates its numbers daily.)
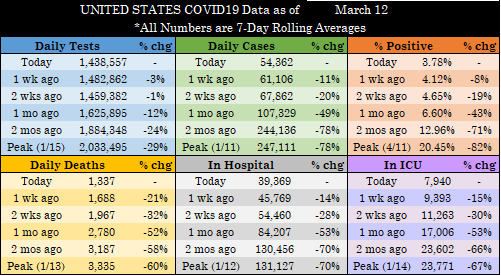
UNITED STATES

Today’s raw reported metrics:
- Tests: 1,209,792 (-34,995)
- Cases: 35,488 (-4,435)
- Deaths: 536 (-303)
- Currently Hospitalized: 36,470 (-375)
- Currently in ICU: 7,369 (-114)
(+/- compared to same day last week for Tests/Cases/Deaths & yesterday for Hosp/ICU)
- Tests: 1,209,792 (-34,995)
- Cases: 35,488 (-4,435)
- Deaths: 536 (-303)
- Currently Hospitalized: 36,470 (-375)
- Currently in ICU: 7,369 (-114)
(+/- compared to same day last week for Tests/Cases/Deaths & yesterday for Hosp/ICU)
The first thing you might notice is the lower positive testing percentage, including in the historical data. This is due my backdating (mostly) testing data for about 35-40% of states to include antigen tests where we report a state’s antigen-positive cases.
I could have tried to standardize by shrinking the numerator and removing antigen cases (and matching confirmed cases + molecular tests, but we’ve gotten used to the case counts where they are, so I chose to increase the denominator and include antigen tests instead.
Realize that there are limits to comparisons, (e.g., different types of tests yield different positive testing percentages). But because we use % percentage more frequently than just tests or cases in a vacuum, my intent is to match cases/tests to the best of our ability.
Also, where a state only reports confirmed cases, we stick to the tests that match if able. So I didn’t just increase all tests. If a state counts antigen-positive cases in our data, I added antigen tests where available. Just trying to match up each state's fraction—that's it.
Give me a bit longer to clean up the presentation on the raw data (and add notes where there were data dumps or removal of data that needs to be factored into any daily data). I’ll add a link to it in this thread.
I know a guy who has a team of folks who gather the same data from the state dashboards, but in leaner fashion and with minor adjustments to testing data to try and glean a more accurate positive testing % on a state-by-state basis.
https://twitter.com/Man_Bear_Pig3/status/1371268719972913156?s=20
I am wiped from sorting this data. Here's a to-be-improved version of the raw data (note the highlighted areas where I address pulling out large data dumps): docs.google.com/spreadsheets/d…
Oh, and "I am wiped" is code for "no regionals tonight."
But I'll provide a couple tidbits: (1) every region is now below 5.5% positive with the updated data, and (2) California is at an impressive 1.87% positive today (7-day average).
But I'll provide a couple tidbits: (1) every region is now below 5.5% positive with the updated data, and (2) California is at an impressive 1.87% positive today (7-day average).
• • •
Missing some Tweet in this thread? You can try to
force a refresh