A cherry-picked stat is creating a media frenzy.
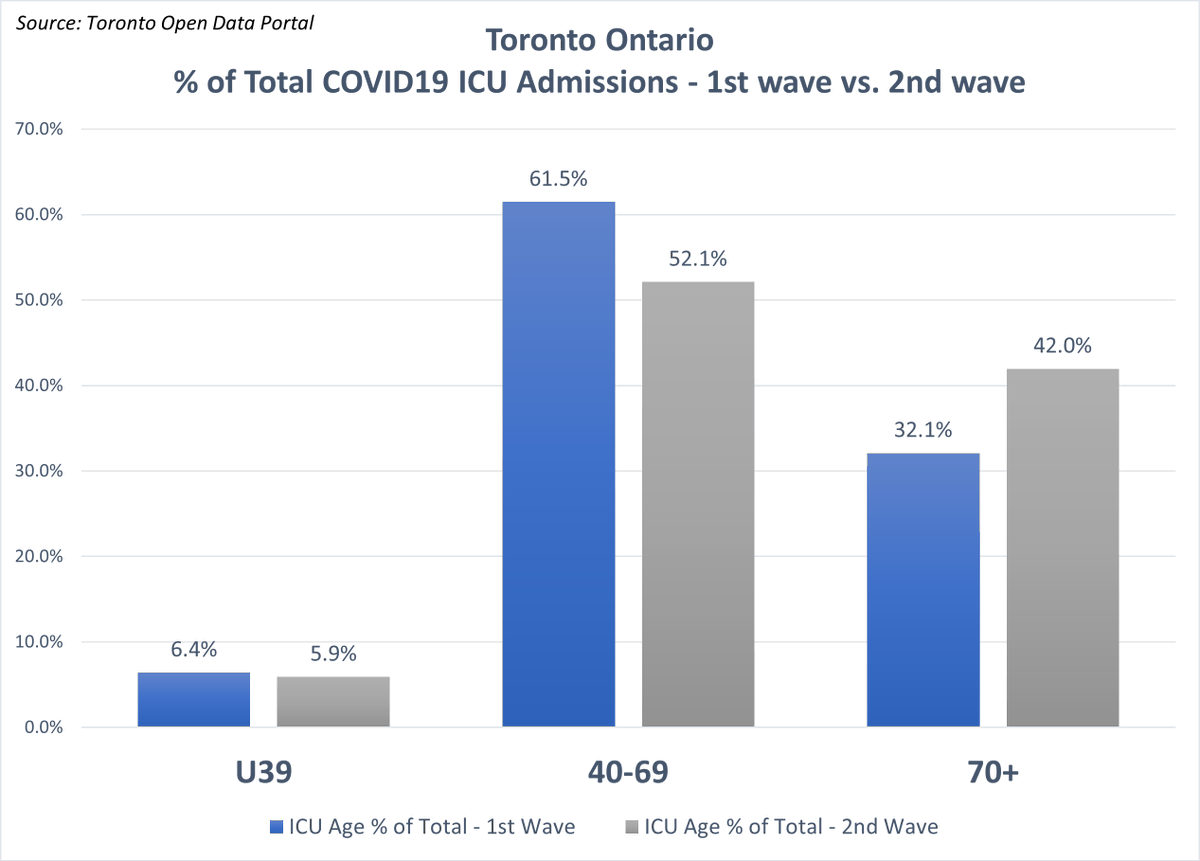
- A 50% ⬆️ in % of ICU admits in "younger people" vs. Dec is driven MOSTLY by admits in the 50-59 cohort!
- Yes, some ⬆️ in # of 49&U admits. BUT, the Ontario Science Table should know:
TWO data points DO NOT make a trend👇


- A 50% ⬆️ in % of ICU admits in "younger people" vs. Dec is driven MOSTLY by admits in the 50-59 cohort!
- Yes, some ⬆️ in # of 49&U admits. BUT, the Ontario Science Table should know:
TWO data points DO NOT make a trend👇
https://twitter.com/COVIDSciOntario/status/1376664575014273027


2/
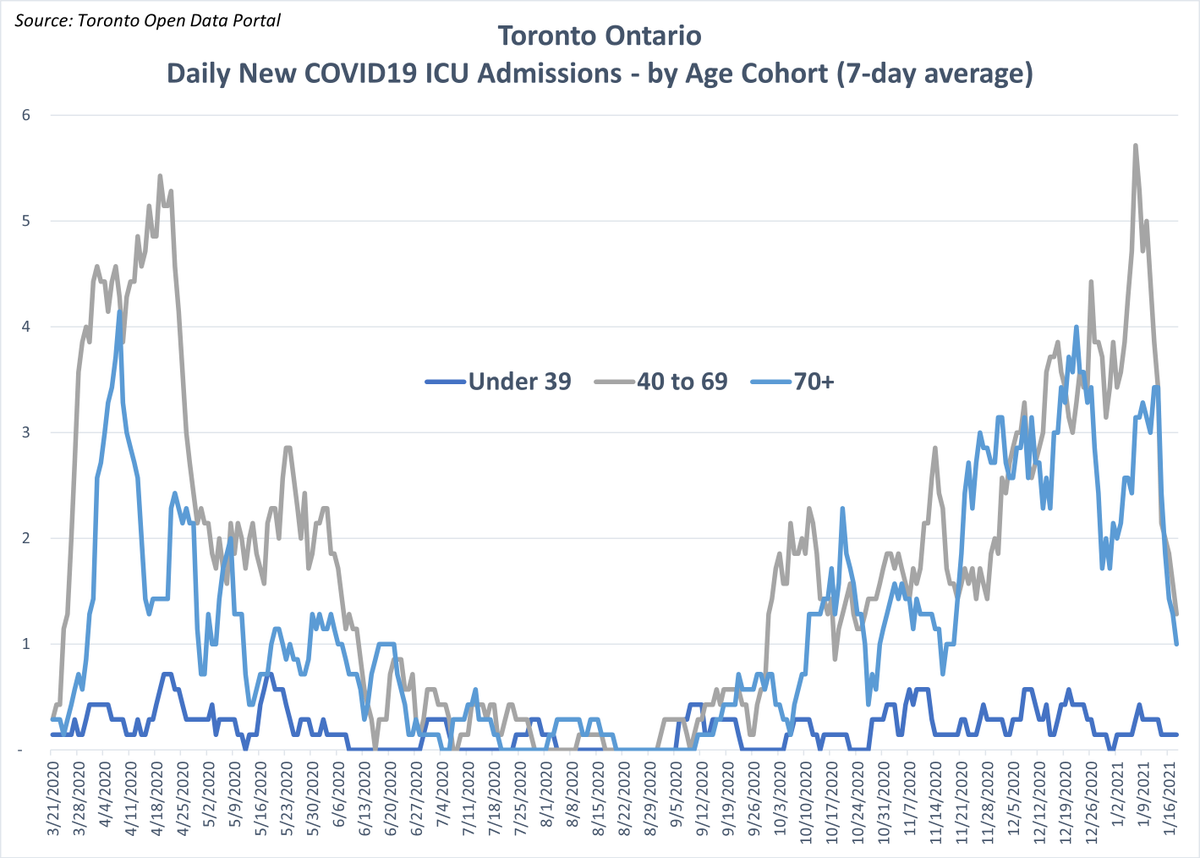
The data in the Toronto Database (as of Mar 22) are abundantly clear:
There were just FIVE (5) Toronto residents 49 & Under in ICU (1 39 & U), down from 12 as of Dec 21/’20
The next weekly Toronto database update is tomorrow, and I will update if there is a material change.
The data in the Toronto Database (as of Mar 22) are abundantly clear:
There were just FIVE (5) Toronto residents 49 & Under in ICU (1 39 & U), down from 12 as of Dec 21/’20
The next weekly Toronto database update is tomorrow, and I will update if there is a material change.

3a/
Related: an Important data note/inquiry for CCSO (@criticalcareON) & @PublicHealthON:
There appears wide divergence in ICU admits between (i) PubHealth Ontario’s Case & Contact Management (CCM) database and (ii) the CCSO data. (The Toronto data cited above is from the CCM).
Related: an Important data note/inquiry for CCSO (@criticalcareON) & @PublicHealthON:
There appears wide divergence in ICU admits between (i) PubHealth Ontario’s Case & Contact Management (CCM) database and (ii) the CCSO data. (The Toronto data cited above is from the CCM).
3b/
@criticalcareON & @publichealthON data inquiry (cont’d):
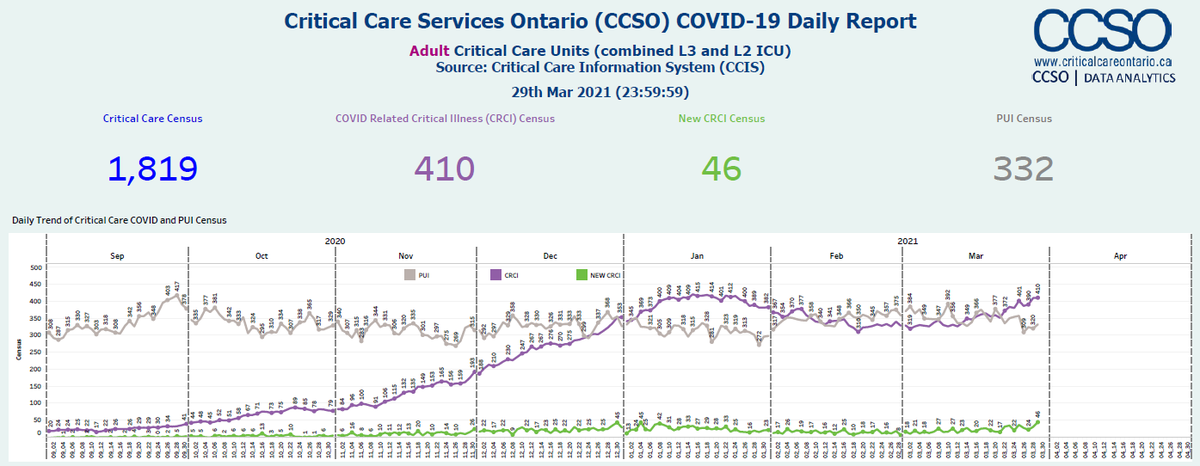
Note the wide difference in “New CRCI Census” (new C19 ICU admits) in the CCSO data (left image, green line) and the daily change in “Ever ICU” in the PubHealth Ontario data (right image) from the daily epi summaries.

@criticalcareON & @publichealthON data inquiry (cont’d):
Note the wide difference in “New CRCI Census” (new C19 ICU admits) in the CCSO data (left image, green line) and the daily change in “Ever ICU” in the PubHealth Ontario data (right image) from the daily epi summaries.


3c/
Also, for example, in its report yesterday, the Ontario Science Table (@COVIDSciOntario) ICU admits # of 157 for Mar 15-21 appears to match the @criticalcareON reports. But this # is much higher than the change in “Ever in ICU” for Mar 15-21 in the @publichealthON CCM data:

Also, for example, in its report yesterday, the Ontario Science Table (@COVIDSciOntario) ICU admits # of 157 for Mar 15-21 appears to match the @criticalcareON reports. But this # is much higher than the change in “Ever in ICU” for Mar 15-21 in the @publichealthON CCM data:


3d /
@criticalcareON and @publichealthON, can you please explain why these daily ICU admit stats appear to differ between your two reporting systems/methods? If there is a simple explanation for this, can you please provide it? Cc: @ONTHealth, @JeanmarcBenoit. Thanks in advance.
@criticalcareON and @publichealthON, can you please explain why these daily ICU admit stats appear to differ between your two reporting systems/methods? If there is a simple explanation for this, can you please provide it? Cc: @ONTHealth, @JeanmarcBenoit. Thanks in advance.
End & Sources/
Toronto Open Data: open.toronto.ca/dataset/covid-…
Ontario Daily Epi Summaries: covid-19.ontario.ca/covid-19-epide…
Toronto Open Data: open.toronto.ca/dataset/covid-…
Ontario Daily Epi Summaries: covid-19.ontario.ca/covid-19-epide…
• • •
Missing some Tweet in this thread? You can try to
force a refresh


