No @IndependentSage briefing today, but I don't want anyone to go into withdrawal though lack of data so here's a short thread on cases and positivity rates.

Overall it's good news.
Positivity rates low and falling or flat across all nations and most of local authorities.
Cases per 100K per week have plateaued for Scotland, England and Northern Ireland with slight falls in Wales.
This is good news, especially after some slight rises previously.
Positivity rates look even more encouraging.

All nations are well below the 5% threshold and continuing to decrease week on week.
Looking more closely at England, all regions seem to be quite flat in terms of case numbers, but still way down from where we were at the start of January.
The North East has seen the biggest week on week drop in cases per 100K.
Yorkshire and Humber saw a slight rise and remain at over 100 cases per 100K.
Regional positivity rates show a slightly different picture most regions are flat or falling with the exception of the North East.
Positivity has increased in the North East, potentially suggesting something strange going on with testing?
Most other regions have seen falls with the exception of Yorkshire and the Humber whose positivity rate remains the highest of any English region.
Just under half (139 out of 315) of English LTLAs showed slight week on week increases in cases per 100K albeit from low levels. This means most fell.

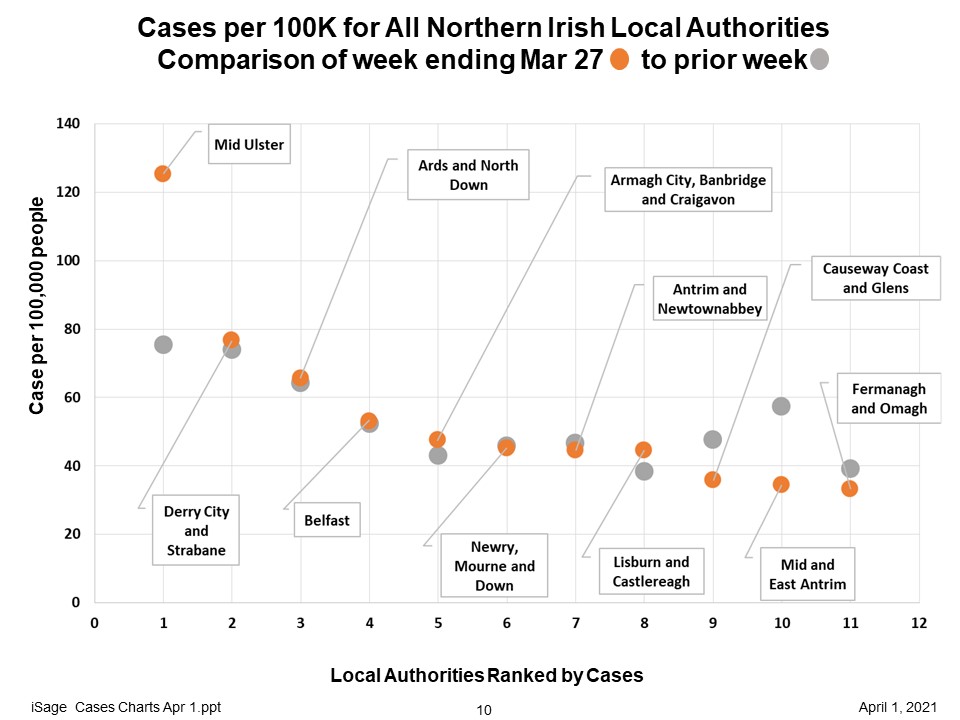
Most Scottish, Welsh and NI LTLAs showed slight week on week reductions in cases per 100K.
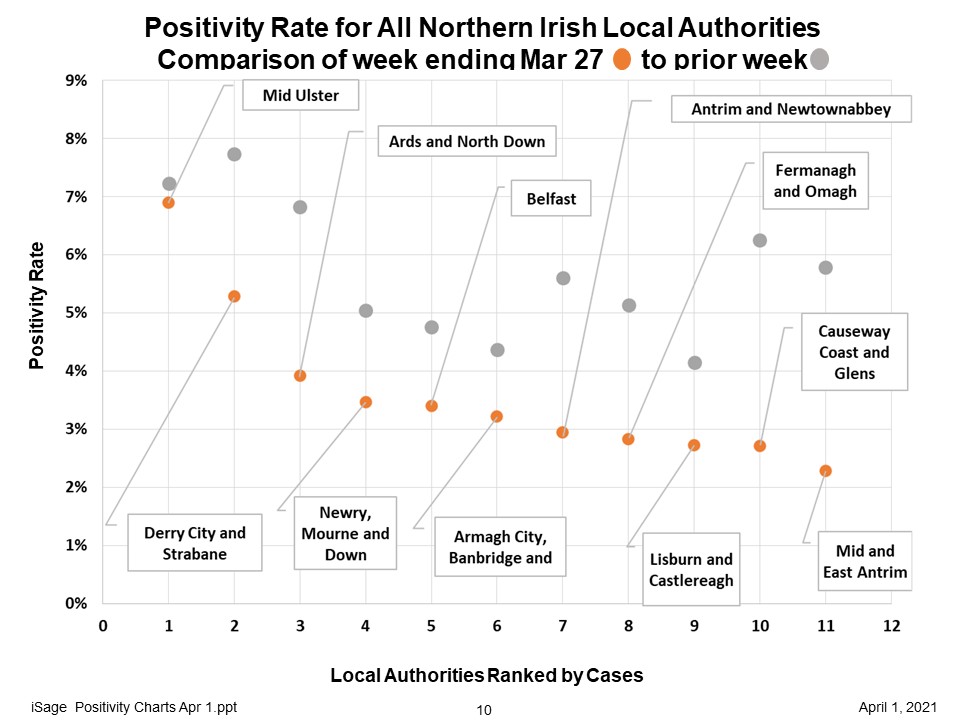
A similar story for positivity rates.
117 out of 315 English local authorities' positivity rates increased week on week albeit from low levels. Again positivity decreased in most regions.

Most Scottish and Welsh LAs showed decreases week on week and all NI LAs decreased.
Over all it looks like a positive picture with cases flat or falling in all regions both in terms of absolute numbers and in terms of positivity rates.
As always, huge thanks to Bob Hawkins for his help with preparing the charts.

• • •

Missing some Tweet in this thread? You can try to force a refresh
 

Keep Current with Kit Yates

Kit Yates Profile picture

Stay in touch and get notified when new unrolls are available from this author!

Read all threads

This Thread may be Removed Anytime!

PDF

Twitter may remove this content at anytime! Save it as PDF for later use!

Try unrolling a thread yourself!

how to unroll video
  1. Follow @ThreadReaderApp to mention us!

  2. From a Twitter thread mention us with a keyword "unroll"
@threadreaderapp unroll

Practice here first or read more on our help page!

More from @Kit_Yates_Maths

2 Apr
Despite the good news in cases over all (see thread below), looking at the data unsegregated by age masks what is happening for different age groups.

We are almost seeing two different epidemic trajectories by age across the UK.

A short🧵
Case rates for ages 20-59 and over 60s remain stable or have reduced slights in most regions.
But case per 100K per week for the under 20s have risen week on week in most regions (with the exception of the North East).
Read 8 tweets
26 Mar
A quick look at the situation of some of our mainland European neighbours.
Summary: There is a third wave happening in Europe at the moment, but it is not the same in every country.
There is no reason to believe that this wave will "Wash up on our shores".
Cases are rising in many European countries as the impact of the higher transmissibility of the UK variant B117 kicks in.
Not all nations are experiencing this wave though. Spain for example has relatively low levels of cases.
The UK still far outranks any other European country in terms of total death toll, although the UK's trajectory is much flatter and other nations like France and Germany are seeing significant rises.
All countries are in a race to vaccinate their populations...
Read 8 tweets
26 Mar
A thread on vaccination data.
Summary: Rollout is going well still although we anticipate a slow down in April due to supply.
Second doses need to keep pace with first doses.

There are stark disparities in those who plan to take up the vaccine based on deprivation and ethnicity.
Vaccination continues apace. Despite record numbers at the end of last week, this week has seen a bit of a slow-down.
More second doses are being given to keep pace with the rate of increase in first doses 12 weeks ago.
We will see first doses drop off in April due to supply.
Over 53% of the adult population have received their first dose now and around 5% have received their second dose as well.
Read 10 tweets
26 Mar
A short good news thread on critical care capacity/occupancy (England).
Summary: Adult critical care bed occupancy is coming down allowing hospitals to start to return to normal functioning.
Adult critical care bed occupancy has fallen in most English regions and is now down below the suggested 80% of capacity threshold in all regions.
(Orange dots are this week's occupancy grey dots are last week's).
Nationally, this year's adult critical care occupancy (blue dashed) has fallen close to last year's levels (orange dashed line) and surge capacity (clue full line) is being decreased correspondingly.
Read 4 tweets
26 Mar
A short thread on schools/case data broken down by age.
Summary: Cases falling in over 20s but rising in under 20s.
Some of the rise may be due to increased testing but not all of it.
Data are consistent with, but not conclusive proof school transmission.
Cases (per 100k per week) continue to fall for the over 60s and for the 20-59 age bracket in all regions of England.
This is not the case for the under 20s...
Cases for the under 20s have begun to rise in all English regions coinciding with the return of schools in England on the 8th of March.
Cases are rising most steeply in Yorkshire and the Humber.
Read 10 tweets
26 Mar
A short thread on cases ahead of today's @IndependentSage briefing.
SUMMARY:
Cases are flat across the UK and in each nation.

Positivity rates, however, are still falling (but more slowly), suggesting case flattening is, in part, a result of increased testing.
UK cases (LFD and PCR by reported date) have fallen dramatically since January, but are not falling any more. Cases have remained flat, at around 5/6K for a couple of weeks now.
Zooming in we can see just how flat cases are, suggesting R is very close to one.
There may be indications of a slight rise in the last week or so, but data is noisy and it's hard to say (from this) how much of the rise may be due to increases in testing.
Read 8 tweets

Did Thread Reader help you today?

Support us! We are indie developers!


This site is made by just two indie developers on a laptop doing marketing, support and development! Read more about the story.

Become a Premium Member ($3/month or $30/year) and get exclusive features!

Become Premium

Too expensive? Make a small donation by buying us coffee ($5) or help with server cost ($10)

Donate via Paypal Become our Patreon

Thank you for your support!

Follow Us on Twitter!