The next few years are going to test how much deflationary capacity there is in the US and global economy from technology, debt, and demographics to absorb the inflationary increase in broad money.

A thread.
In terms of overall fiscal and monetary policy, including the wartime-like fiscal response that we’ve seen over the past year, the 2020s so far have structural similarities to the 1940s.

Here’s the long-term debt cycle, for example:
During the 1930s, monetary policy hit the limit of what it can do against the prospect of a private debt bubble, and so it was then a massive fiscal response in the 1940s, forced by external factors (the war), that pumped inflation:
Similarly, the 2010s had a partial unwinding of a private debt bubble and a large monetary response, but limited fiscal response.

It wasn’t until the pandemic in 2020 that policymakers brought out the fiscal cannon.
Deflation proponents often point out that the money multiplier (broad money as a multiple of the monetary base) is low right now. That’s true.

However, the only other time it was this low (the 1940s), was actually quite inflationary.
Some people dismiss the 1940s inflationary period as being just transient spikes of inflation due to specific temporary shortages.

And indeed, the inflation of that era came in bursts:
However, the consumer price index never returned to baseline after those inflationary spikes. Those spikes each brought broad prices up to permanently higher levels.

From 1940-1952, the consumer price index went up 90% and stayed there forever.
The reason those 1940s price increases were not transient, is because behind the surface of commodity shortages there was a massive increase in the broad money supply due to fiscal spending, which was effectively monetized.
In other words, if extreme fiscal policy were not occurring in the 1940s, prices would go back to normal after their brief spike from temporary shortages.

The reason they didn’t go back to normal was because the currency itself was devalued.
And that’s not a criticism of policymakers in the era. For investors, there were winners and losers in that scenario depending on what asset classes they were primarily in.

Since it was a currency devaluation, it was cash and bondholders that took the brunt of it.
The deflationary capacity of the current economy is huge, due to automation, software, high debt, wealth concentration, and aging demographics.

And policymakers will be putting that deflationary force to the test.
If they can do a large fiscal burst (spending without associated tax increases), and there is no big inflationary response, then the incentive exists for them to do it again. And again. And again. The only limiter would be obvious inflation.
To the extent that broad money supply goes up a lot and CPI and bond yields stay relatively low, then the money tends to pile into financial assets, since it has to go somewhere. Lately that’s what the situation has been.
In April/May (reported May/June), we’ll get some higher year-over-year CPI prints from low base effects.

After that, broad inflation levels will partly depend on what happens with the next round of fiscal stimulus: if it passes, how big it is, what it targets, etc.
Some of my chart legends didn't update properly. Money multiplier should be rhs here (aka right axis), not lhs. The others are lhs.

• • •

Missing some Tweet in this thread? You can try to force a refresh
 

Keep Current with Lyn Alden

Lyn Alden Profile picture

Stay in touch and get notified when new unrolls are available from this author!

Read all threads

This Thread may be Removed Anytime!

PDF

Twitter may remove this content at anytime! Save it as PDF for later use!

Try unrolling a thread yourself!

how to unroll video
  1. Follow @ThreadReaderApp to mention us!

  2. From a Twitter thread mention us with a keyword "unroll"
@threadreaderapp unroll

Practice here first or read more on our help page!

More from @LynAldenContact

24 Mar
Bitcoin's total energy usage is determined primarily from market capitalization and difficulty adjustments, not transaction volume.

In other words, the marginal bitcoin transaction/spending choice has virtually no impact on bitcoin's total energy usage.
Like with a company, it takes a ton of work to make a good software product (equipment, staff, time, etc).

But then, it takes minimal work to send that software to 1,000,000,000 users compared to 10,000 users.

High base cost for it to exist + tiny cost per marginal user.
Bitcoin's overall energy usages does go up with adoption as a store of value as its market cap grows, but in a nonlinear way as it matures. It needs to be secure to function, but from there, its marginal cost per user is efficient.
swanbitcoin.com/bitcoin-fee-ba…
Read 12 tweets
7 Mar
Congrats to @JanBlachowicz for his successful title defense. Commentators were pretty biased against him during the fight but he had a near-perfect conservative approach. The champion was the betting underdog and even during the fight, he didn't get enough respect. #UFC259
There's a lesson in here about markets somewhere, probably around the topic of bias.

Imagine a fight where one person objectively lands more hits in every round (and bigger/harder), and yet commentators and viewers think the other person is winning.
Partly this is from charisma/narrative momentum going into the fight, and then also how they "look" while fighting, with one looking crisp (but getting hit more lol) and never really putting the other in danger, and the other looking slower (but hitting more, and harder).
Read 4 tweets
19 Feb
Unless Yellen changes plans, then during the next several months, over $1T from the Treasury General Account is going to pour into bank reserves.
Despite massive T-bill issuance, there is actually a shortage of T-bills out there now relative to capital (complete opposite problem of late-2019 repo spike).

Short end of the Treasury curve is falling due to collateral shortage, while long end is rising.
For example, after the 2019 repo spike, the problem was too many t-bills vs cash. The Fed's transition from repo support to outright QE (T-bill buying) in was predictable a couple weeks in advance.

Read 6 tweets
16 Feb
It'll be interesting to see who has the balance sheet capacity to absorb the Treasury issuance in the second half of 2021, and at what price.

1H2021 won't have much Treasury issuance, due to the planned TGA drawdown. 2H2021, however, likely gets tight.
If the private sector has to buy it, yields likely go higher, which all else being equal puts pressure on growth equity valuations.

If the Fed has to step in and buy more Treasuries for lack of sufficient demand, that's kind of Minsky Moment for the dollar.
This will require monitoring all year. The problem was going to start earlier, because Treasury was planning a ton of issuance in 1H2021, but under Yellen, the Treasury revised that down on February 1st to draw down TGA for now instead. So now more like a 2H2021 issue.
Read 6 tweets
4 Feb
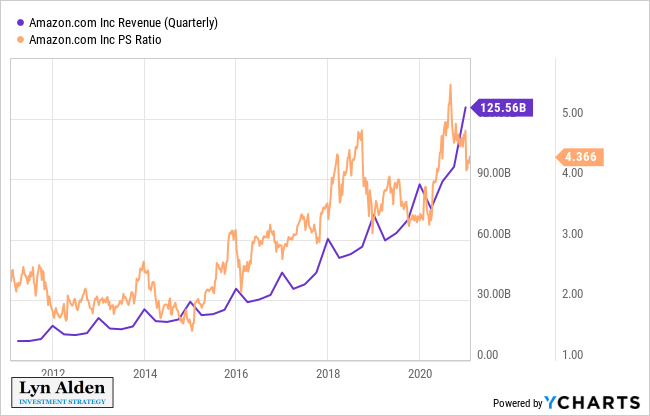
Quick thread on $AMZN valuation.

From a price to sales perspective, it remains elevated compared to its history:
However, operating cash flow has grown more quickly than revenue.

From a price to cash flow perspective, Amazon is near the mid-to-low end of its historical valuation range:
Amazon stock has followed a 25x operating cash flow multiple almost like clockwork for nearly two decades.

Chart via @FASTGraphs
Read 4 tweets
22 Jan
Ethereum folks including @BanklessHQ and @VitalikButerin crowdsourced a response to my Ethereum article:

newsletter.banklesshq.com/p/open-reply-t…
Some responses are fair (e.g. the hash rate chart wasn't ideal), while other ones I still view differently.

The core thesis of my article (Eth still very early on in development; changing the underlying structure while building on top of it) doesn't appear to be disagreed with.
Another paper I would direct folks to is this one: s3.eu-west-2.amazonaws.com/john-pfeffer/A…

Three years old but still highly relevant (and arguably playing out a bit at this point).

TLDR: token appreciation (mkt cap) and ecosystem growth (trans volume) not necessarily correlated long-term.
Read 5 tweets

Did Thread Reader help you today?

Support us! We are indie developers!


This site is made by just two indie developers on a laptop doing marketing, support and development! Read more about the story.

Become a Premium Member ($3/month or $30/year) and get exclusive features!

Become Premium

Too expensive? Make a small donation by buying us coffee ($5) or help with server cost ($10)

Donate via Paypal Become our Patreon

Thank you for your support!

Follow Us on Twitter!