1/ IMPORTANT ICU DATA UPDATE
*This is not a tangential issue*
It directly impacts ICU narrative:
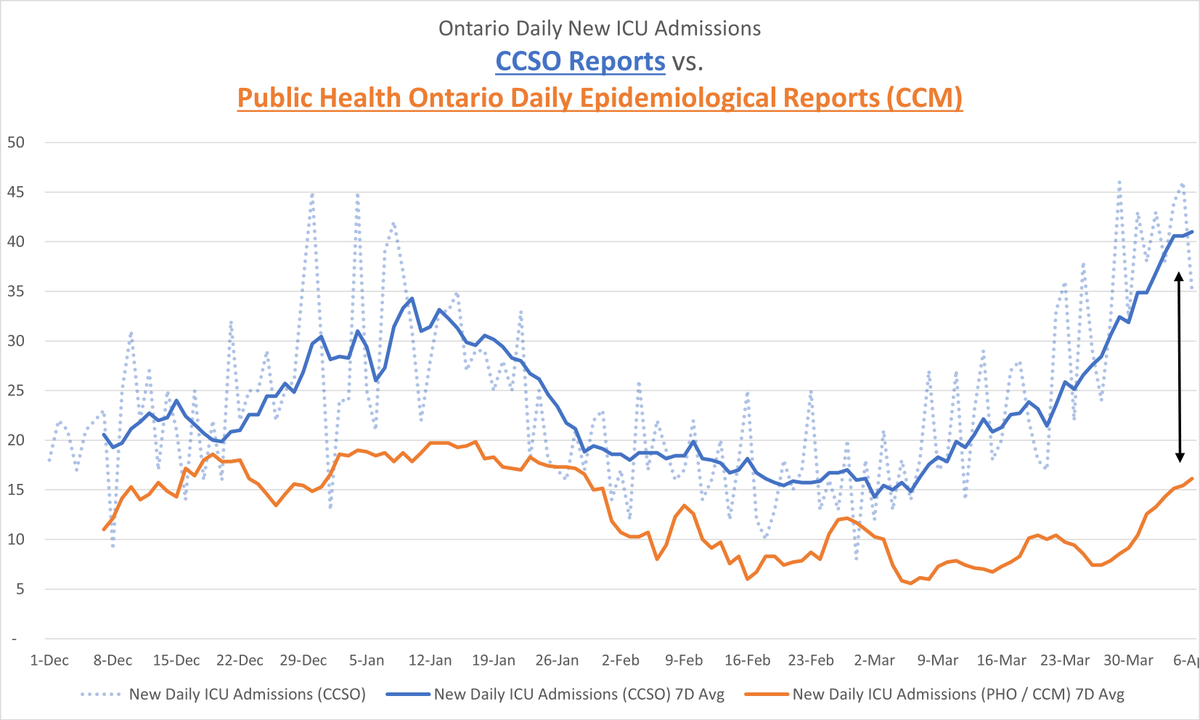
CCSO (live ICU) vs. CCM (gov’t patient database) continue to *DIVERGE MATERIALLY*
CCSO vs. CCM differ 3-fold!
@CriticalCareON & @publicHealthON must clarify:

*This is not a tangential issue*
It directly impacts ICU narrative:
CCSO (live ICU) vs. CCM (gov’t patient database) continue to *DIVERGE MATERIALLY*
CCSO vs. CCM differ 3-fold!
@CriticalCareON & @publicHealthON must clarify:
https://twitter.com/covid19mc/status/1377778480448995331?s=20

2/ IMPORTANT ICU DATA UPDATE
CCSO daily new C-19 admissions are now almost FORTY-FIVE PERCENT (~45%) of new C-19 hospitalizations
A rising trend since Feb 1st, up from a range in the mid-20%s thru the winter wave
And 3X higher than CCM data (still in a consistent 10-20% band).
CCSO daily new C-19 admissions are now almost FORTY-FIVE PERCENT (~45%) of new C-19 hospitalizations
A rising trend since Feb 1st, up from a range in the mid-20%s thru the winter wave
And 3X higher than CCM data (still in a consistent 10-20% band).

3/ IMPORTANT ICU DATA UPDATE
Note that for the entire pandemic, the national average of ICU admissions to total hospitalizations has been ~17.5%, according to PHAC weekly updates.
45% of new hospital admits being ICU admits is a massive statistical divergence!
Note that for the entire pandemic, the national average of ICU admissions to total hospitalizations has been ~17.5%, according to PHAC weekly updates.
45% of new hospital admits being ICU admits is a massive statistical divergence!


4/ IMPORTANT ICU DATA UPDATE
On overall ICU counts in Ontario: notice @DrKaliBarrett only tells half of the story..
*Fluctuations in C19 ICU admits or C19 ICU levels DO NOT HAVE a material impact on # of overall ICU patients* (according to CCSO data)
On overall ICU counts in Ontario: notice @DrKaliBarrett only tells half of the story..
*Fluctuations in C19 ICU admits or C19 ICU levels DO NOT HAVE a material impact on # of overall ICU patients* (according to CCSO data)
https://twitter.com/DrKaliBarrett/status/1379779560921792512?s=20


5/ IMPORTANT ICU DATA UPDATE
And note that despite fluctuating C19 daily admissions, the ICU % utilization has been stable, and actually decreasing through the entire winter wave to current.
(Note: ~200 beds have been added since early December per CCSO)
And note that despite fluctuating C19 daily admissions, the ICU % utilization has been stable, and actually decreasing through the entire winter wave to current.
(Note: ~200 beds have been added since early December per CCSO)

6/ IMPORTANT ICU DATA UPDATE
Tagging @PublicHealthON @criticalcareON @ICESOntario @BeateSander @DrKaliBarrett @celliottability @ONThealth @AnthonyDaleOHA
Please address why the CCM pt DB is persistently undercounting "Ever in ICU" pts vs. CCSO? Is there a simple explanation?
Tagging @PublicHealthON @criticalcareON @ICESOntario @BeateSander @DrKaliBarrett @celliottability @ONThealth @AnthonyDaleOHA
Please address why the CCM pt DB is persistently undercounting "Ever in ICU" pts vs. CCSO? Is there a simple explanation?

ADDENDUM/
Data from CCSO Reports; h/t @JeanMarc for compiling daily since December 2020
CCM ICU/Hospital Data from Ontario Data Catalogue: data.ontario.ca/en/dataset/con…
Data from CCSO Reports; h/t @JeanMarc for compiling daily since December 2020
CCM ICU/Hospital Data from Ontario Data Catalogue: data.ontario.ca/en/dataset/con…
ADDENDUM edit/
h/t @JeanmarcBenoit for compiling the CCSO data
h/t @JeanmarcBenoit for compiling the CCSO data
• • •
Missing some Tweet in this thread? You can try to
force a refresh