Prashant Profile picture
17 Apr, 14 tweets, 4 min read
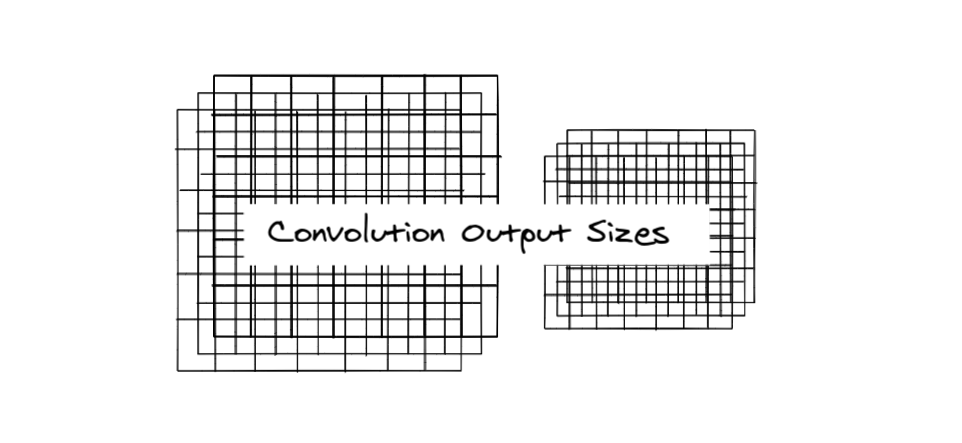
Calculating Convolution sizes is something that I found particularly hard after understanding convolutions for the first time.

I couldn't remember the formula because I didn't understand its working exactly.

So here's my attempt to get some intuition behind the calculation.🔣👇 Image
BTW if you haven't read the thread 🧵 on 1D, 2D, 3D CNN, you may want to check it out once.

First, observe the picture below🖼 Image
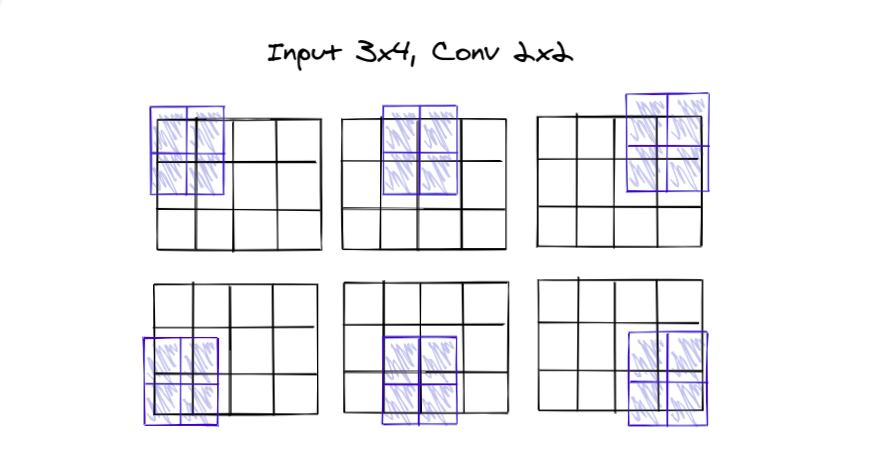
The 2 x 2 filter slides over the
3 rows, 2 times and,
4 columns, 3 times

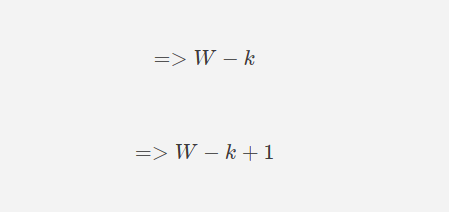
So, let's try subtracting the filter size first
3 - 2 = 1
4 - 2 = 2

Looks short, we'll need to compensate the 1 in both.
3 - 2 + 1 = 2
4 - 2 + 1 = 3

hence the formula so far becomes: Image
Now let's discuss padding0⃣

Zero padding makes it possible to get output equal to the input by adding extra columns.

It provides extra space for the sliding, making up for the lost space Image
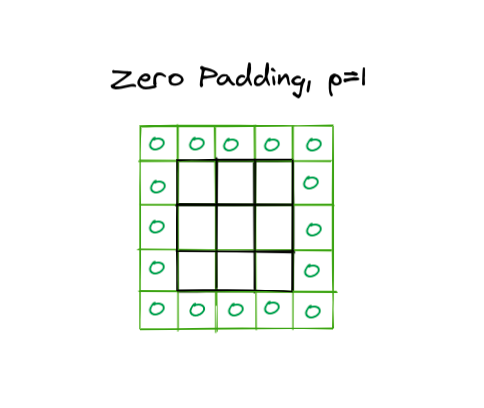
Padding of p would mean increasing the input size by adding p to both sides

Considering width, there will be padding for left and for right, both equal, same for the height.

The modified formula becomes Image
All of our calculation so far assumes that we are taking one step at a time during sliding, a stride of 1

What if we take more than that?🏃

We will be cutting our distance short by increasing the size of our leap. So to account for this we will divide with stride size. Image
Keep in mind that we should make sure that the calculation doesn't go into decimals.

We generally select our values in such a way that the calculations result in an integer.
Now as we may remember from the last thread, that one filter leads to 1 output, be it 1D, 2D...

So the depth of the output will be equal to the number of filters applied. Image
With all that in mind, let's try to solve a simple question below: Image
We can try the same using Keras and its functions. Image
This website is a ConvNet shape calculator with which you can play around a little bit for better understanding.

madebyollin.github.io/convnet-calcul…
Now if you feel like you can calculate correctly, try to pick any network and calculate its output sizes, validate using the model summary.

Or pick 3D convolutions and calculate its outputs, the principle remains the same.
All the above points helped me to be able to understand the CNN architectures better and not be bothered by the output summary.

Hope this helps you too! 👍 Image

• • •

Missing some Tweet in this thread? You can try to force a refresh
 

Keep Current with Prashant

Prashant Profile picture

Stay in touch and get notified when new unrolls are available from this author!

Read all threads

This Thread may be Removed Anytime!

PDF

Twitter may remove this content at anytime! Save it as PDF for later use!

Try unrolling a thread yourself!

how to unroll video
  1. Follow @ThreadReaderApp to mention us!

  2. From a Twitter thread mention us with a keyword "unroll"
@threadreaderapp unroll

Practice here first or read more on our help page!

More from @capeandcode

30 Apr
Since 2000 of you have connected with me.
Here are some of the most informative threads that I posted this month ↓

You can find all the good threads on my twitter github repository as well

github.com/hashbanger/Twi…

Thanks ! Gracias ! धन्यवाद ! ✨
Read 8 tweets
29 Apr
PCA is one of the most famous algorithms for dimensionality reduction and you are very likely to have heard about it in Machine Learning.

But have you ever seen it in action on a dataset?

If not, check this thread 🧵↓ for a quick depiction:
If you are not sure how PCA works, check this wonderful thread by @TivadarDanka

Let us consider a very simple Image Dataset, the Fashion MNIST dataset, which has thousands of images of fashion apparel.

Using PCA we can reduce the amount of information that we want, we can choose up to a certain amount that seems necessary for our particular task. Image
Read 8 tweets
20 Apr
If you don't understand the principle of Backpropagation or the notion of the maths behind it.

Then this 🧵 could be helpful for you.

We are going to use a simple analogy to understand better

(Check final tweets for notes)

↓ 1/11
Consider you (Harry) are trying to solve a puzzle along with two of your friends, Tom and Dick
And sadly none of you guys are among the brightest.

But you start trying to put the puzzle together.

2/11
Tom has put the first 6 pieces out of 20, 2 of them are wrong, then passes the puzzle to Dick.
Dick puts the next 8 pieces, 6 of them wrong, then passes the puzzle to you.
And now, you put the final 6 pieces, 4 of them wrong.

The picture is complete.

3/11
Read 12 tweets
14 Apr
Convolutions! 1D! 2D! 3D!🔲

I've had a lot of trouble understanding different convolutions
What do different convolutions do anyway❓

Without the correct intuition, I found defining any CNN architecture very unenjoyable.

So, here's my little understanding (with pictures)🖼👇
The Number associated with the Convolution signifies two things:
🔸The number of directions the filter moves in and,
🔸The dimensions of the output

Each convolution expects different shapes of inputs and results in output equal to the dimensions it allows the filter to move in.
In 1⃣D-Conv, the kernel moves along a single axis.
It is generally applied over the inputs that also vary along a single dimension, ex: electric signal.

The input could be a 1D array and a small 1D kernel can be applied over it to get another 1D array as output.
Read 9 tweets
12 Apr
Types of Models

In Time-Series Data, we have to observe which model fits the nature of the current data.

Two types of Models are:

🔸Additive Models
🔸Multiplicative Models

Let's discuss in brief 👇 Image
ADDITIVE MODELS

🔹Synthetically it is a model of data in which the effects of the individual factors are differentiated and added to model the data.

It can be represented by:

𝘆(𝘁) = 𝗟𝗲𝘃𝗲𝗹 + 𝗧𝗿𝗲𝗻𝗱 + 𝗦𝗲𝗮𝘀𝗼𝗻𝗮𝗹𝗶𝘁𝘆 + 𝗡𝗼𝗶𝘀𝗲
🔹An additive model is optional for Decomposition procedures and for the Winters' method.

🔹An additive model is optional for two-way ANOVA procedures. Choose this option to omit the interaction term from the model.
Read 8 tweets
31 Mar
How would you interpret the situation if you train a model and see your graphs like these? 📈📉

#machinelearning
If you just focus on the left side, it seems to make sense.
The training loss going down, the validation loss going up.
Clearly, seems to be an overfitting problem? Right?
But the graphs on the right don't seem to make sense in terms of overfitting.

The training accuracy is high, which is fine, but why is that validation accuracy is going up if the validation loss is getting worse, shouldn't it go down too?

Is it still overfitting?

YES!
Read 9 tweets

Did Thread Reader help you today?

Support us! We are indie developers!


This site is made by just two indie developers on a laptop doing marketing, support and development! Read more about the story.

Become a Premium Member ($3/month or $30/year) and get exclusive features!

Become Premium

Too expensive? Make a small donation by buying us coffee ($5) or help with server cost ($10)

Donate via Paypal Become our Patreon

Thank you for your support!

Follow Us on Twitter!