The US has committed to an ambitious goal of reducing emissions by 50% to 52% in 2030 relative to 2005 levels. In a new analysis, we look at what we are on track for today, and the additional reductions that would be needed to meet the new goal: thebreakthrough.org/issues/energy/… 1/16
The US has reduced its CO2 emissions by about 20% since 2005. However, nearly all those reductions have been concentrated in the power sector. If current trends continue, we expect US CO2 emissions to be around 30% lower than 2005 levels in 2030: 2/
In this current-trends-continue scenario, electric power sector emissions will fall 60% by 2030 compared to 2005 levels. Residential emissions will fall 18%, transportation emissions 15%, industrial emissions 5%, and commercial emissions will increase by 14%. 3/
This is pretty well in-line with the recent @IEA 2020 World Energy Outlook, which suggests that US CO2 emissions will be 31% below 2005 levels in 2030 in its Stated Policy Scenario. 4/
The additional reductions in CO2 emissions cannot happen in the power sector alone. Even fully eliminating power sector emissions by 2030 – an unlikely outcome given the timeframe and limitations of current clean electricity technologies – would only result in a 47% reduction. 5/
One possible pathway toward meeting the 50% target would involve a combination of accelerated power sector CO2 reductions, rapid electric vehicle uptake in the transportation sector, and a modest decline in other sectors relative to the current-trends-continue scenario. 6/
By 2030 this ambitious scenario would involve:
⬇ Zero coal use
⬇ 33% lower gas use
⬆ 50% of vehicle sales as electric (and 25% of the vehicle fleet)
⬇ 15% additional reduction in building and industry emissions relative to current trends continuing.
7/
Here power sector emissions decline by 83% in 2030 relative to 2005 levels. Transport by 33%, residential by 26%, industrial by 19%, and commercial by 10%. The overall emissions declines are similar the @IEA's Sustainable Development Scenario. 8/
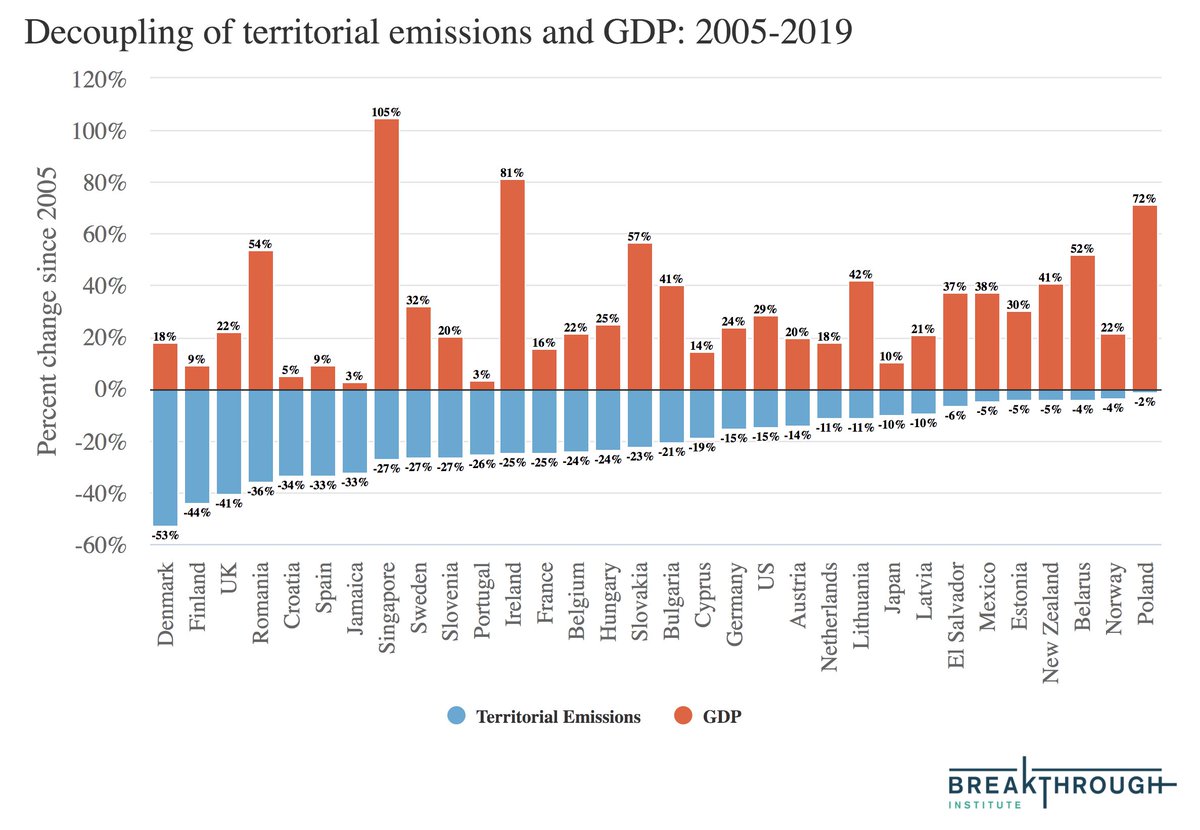
Something like this would be achievable – other countries like the UK and Denmark have already achieved closer to 50% cuts – but it will not happen through technology alone in a current policy world. thebreakthrough.org/issues/energy/… 9/
Even the policies currently proposed by the Biden administration – such as the infrastructure bill – would be unlikely to achieve this goal by themselves. It remains unclear what the political pathway might be to meet this target. 10/
While it is possible that political dynamics might change in the next nine years, the slow turnover of capital – particularly for transport and buildings – means that a transition to clean energy technologies needs to begin sooner rather than later across all of these sectors 11/
Another way to look at the scale of the challenge is to look at how the rate of decarbonization of the economy — the amount of CO2 emitted per unit of GDP — would have to change to meet the 2030 target: 12/
The 50% target would require a dramatic expansion of the rate of decarbonization. Since 2005 the US has decarbonized its economy at an average rate 3.1% per year. This would have to double to a rate of 6.2% per year through 2030. 13/
All of these estimates focus on CO2 emissions from energy as that data is readily available. A full accounting of GHGs and embodied emissions in things like electric vehicle batteries and other new energy infrastructure would likely make the target more difficult to achieve. 14/
Targets can have a useful role in signaling intent and convince others to adopt more ambitious measures. At the same time, theres a disconnect between the types of industrial policies that the Biden administration is pursuing and the specificity implied by the 2030 target. 15/
There is unlikely to be any sort of binding sectoral-level emission caps introduced in the US in the next few years – outside of possibly a clean electricity standard. What matters in the long run is putting the US on track for net-zero emissions in the following decades. 16/16

• • •

Missing some Tweet in this thread? You can try to force a refresh
 

Keep Current with Zeke Hausfather

Zeke Hausfather Profile picture

Stay in touch and get notified when new unrolls are available from this author!

Read all threads

This Thread may be Removed Anytime!

PDF

Twitter may remove this content at anytime! Save it as PDF for later use!

Try unrolling a thread yourself!

how to unroll video
  1. Follow @ThreadReaderApp to mention us!

  2. From a Twitter thread mention us with a keyword "unroll"
@threadreaderapp unroll

Practice here first or read more on our help page!

More from @hausfath

6 Apr
In a new analysis, we find there are now 32 countries that have absolutely decoupled economic growth from CO2 since 2005. In these places both territorial emissions and consumption emissions (which include CO2 imported in goods) are falling. thebreakthrough.org/issues/energy/…
A thread: 1/21
Absolute decoupling has long been controversial, with some arguing that economic growth is fundamentally incompatible with emissions reductions. However, around 15 years ago things began to change. 2/
Rather than a 21st century dominated by coal that energy modelers foresaw, global coal use peaked in 2013 and is now in structural decline. We have succeeded in making clean energy cheap, with solar power and battery storage costs falling 10-fold since 2009. 3/
Read 26 tweets
2 Apr
There are reasonable criticisms of too much reliance on assumed future carbon removal, and real barriers to scaling. At best it can offset a long tail of hard to decarbonize emissions and recover from overshoot.

But ruling out large-scale NETs makes 1.5C almost impossible. 1/6
The math of the 1.5C target is brutal, since we are already at between 1.2C and 1.4C today. Either all global emissions need to go to zero in the next 10-20 years, or you need to use large-scale net-negative emissions – as nearly all emissions scenarios used by the IPCC do: 2/6
Natural climate solutions can certainly get us some of the way there. But there are limits to how far they can scale, and real questions about permanence of biological carbon stores in a warming (and fire-prone) world. 3/6 carbonbrief.org/analysis-how-n…
Read 8 tweets
30 Mar
To measure the climate of the distant past we rely on "proxy" measurements from things like tree rings, sediments, and corals. In a new @carbonbrief explainer @rtmcswee, @tomoprater, and I created an interactive map of nearly all the worlds proxy data. interactive.carbonbrief.org/how-proxy-data…
We take a deep dive into all the different types of proxy records across many different climate variables (not just temperatures!):
We also take a look at the evolution of global temperature records based on proxies, both for the past 2000 years and the past 12,000:
Read 6 tweets
24 Mar
This is actually an interesting question: would a $45k purchase in bitcoin result in a emissions associated with a verifying a single bitcoin transaction (~0.4 tons) or the average CO2 per dollar equivalent of transactions (~2 kg CO2/$, so ~96 tons)?
This makes quite the difference; the former would reduce the benefits of switching from an ICE to a Tesla by around 1.5%, while the latter would make the Tesla 3x worse than an ICE vehicle!
Sources:

CO2 footprint of Bitcoin: digiconomist.net/bitcoin-energy…
Annual dollar transactions: ycharts.com/indicators/bit…
Benefits of Tesla vs ICE on emissions: carbonbrief.org/factcheck-how-…

*also caveat that I haven't had my coffee yet so forgive any egregious math errors.
Read 4 tweets
22 Mar
Some claim we can never absolutely decouple economic growth from CO2.

However, the UK is an example of how emission reductions need not come at the expense of prosperity.

Since 1990, the UK's real GDP has increased 80%; at the same time, their emissions have fallen 50%.
And, yes, this just includes territorial emissions; some of the decline since 1990 is associated with offshoring.

But consumption emissions (e.g. from all goods consumed in the UK) have been falling just as rapidly as territorial emissions since 2007: carbonbrief.org/analysis-why-t…
Its not just the UK; here is my home state of California's economic growth and emissions since 1990:
Read 10 tweets
11 Mar
Lying in the service of what you think is right is still lying. @ClimateOfGavin said nothing of the sort, and you should be ashamed for putting words in his mouth.

We can control the level of warming that occurs. While 1.5C is quite challenging, <2C is increasingly achievable.
Current policies adopted by countries put us on track for around 3ºC of warming by the end of the century, compared to the late 1800s. Including pledges and targets – such as those included in the Paris Agreement – brings this down to around 2.5ºC.
Countries representing around half of global emissions – including China – have pledged to reach net-zero by 2050 or 2060. If these longer term commitments are achieved, it would bring end-of-century warming down close to 2ºC.
Read 6 tweets

Did Thread Reader help you today?

Support us! We are indie developers!


This site is made by just two indie developers on a laptop doing marketing, support and development! Read more about the story.

Become a Premium Member ($3/month or $30/year) and get exclusive features!

Become Premium

Too expensive? Make a small donation by buying us coffee ($5) or help with server cost ($10)

Donate via Paypal Become our Patreon

Thank you for your support!

Follow Us on Twitter!