One year ago today, @CAPolicyLab's "UI Team" released its 1st Report.
We partnered with @CA_EDD to analyze CA's administrative data on UI claimants, focusing on the nature of the crisis & how it was affecting workers in near real-time.
Today, we review our 10 biggest takeaways:
We partnered with @CA_EDD to analyze CA's administrative data on UI claimants, focusing on the nature of the crisis & how it was affecting workers in near real-time.
Today, we review our 10 biggest takeaways:

1) As the crisis dragged on, Benefit extension programs such as PEUC and FED-ED (aka EB) have become increasingly important in supporting unemployed workers.
SEVENTY PERCENT of regular UI claimants receiving benefits in April 2021 were on an extension program.
SEVENTY PERCENT of regular UI claimants receiving benefits in April 2021 were on an extension program.

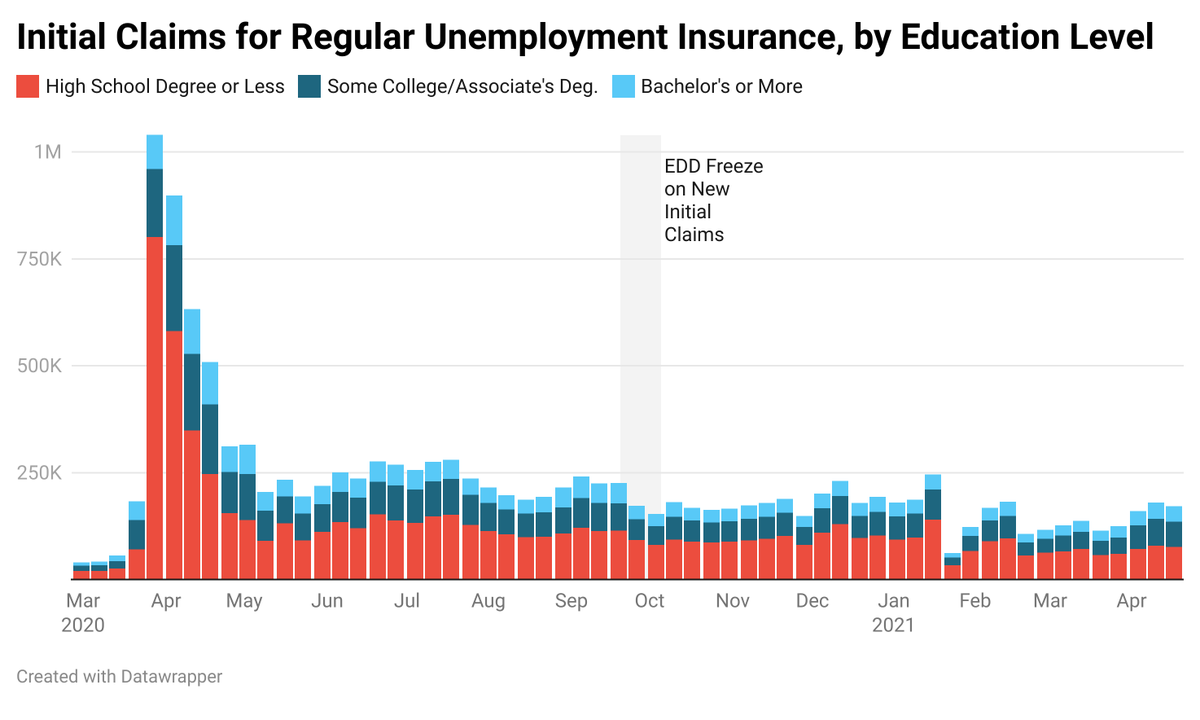
2) The COVID-19 crisis hit the hospitality and food services sector hardest.
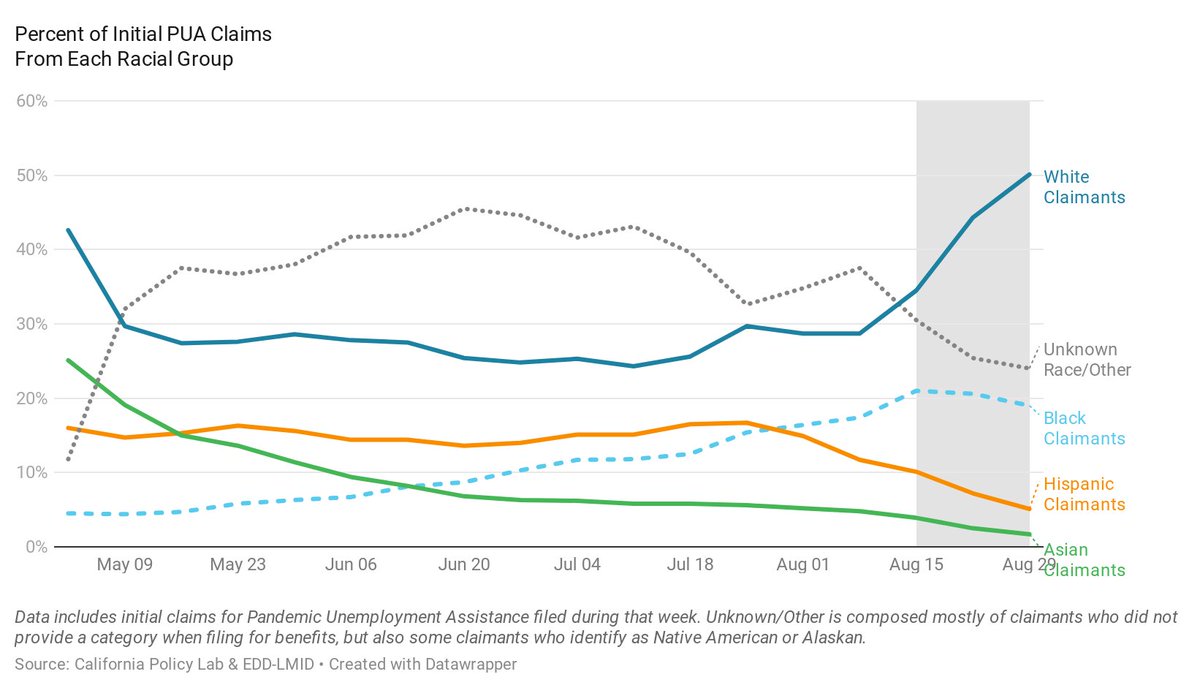
Through this mechanism (and others), it has disproportionately impacted less educated workers, workers of color, and women.
Through this mechanism (and others), it has disproportionately impacted less educated workers, workers of color, and women.
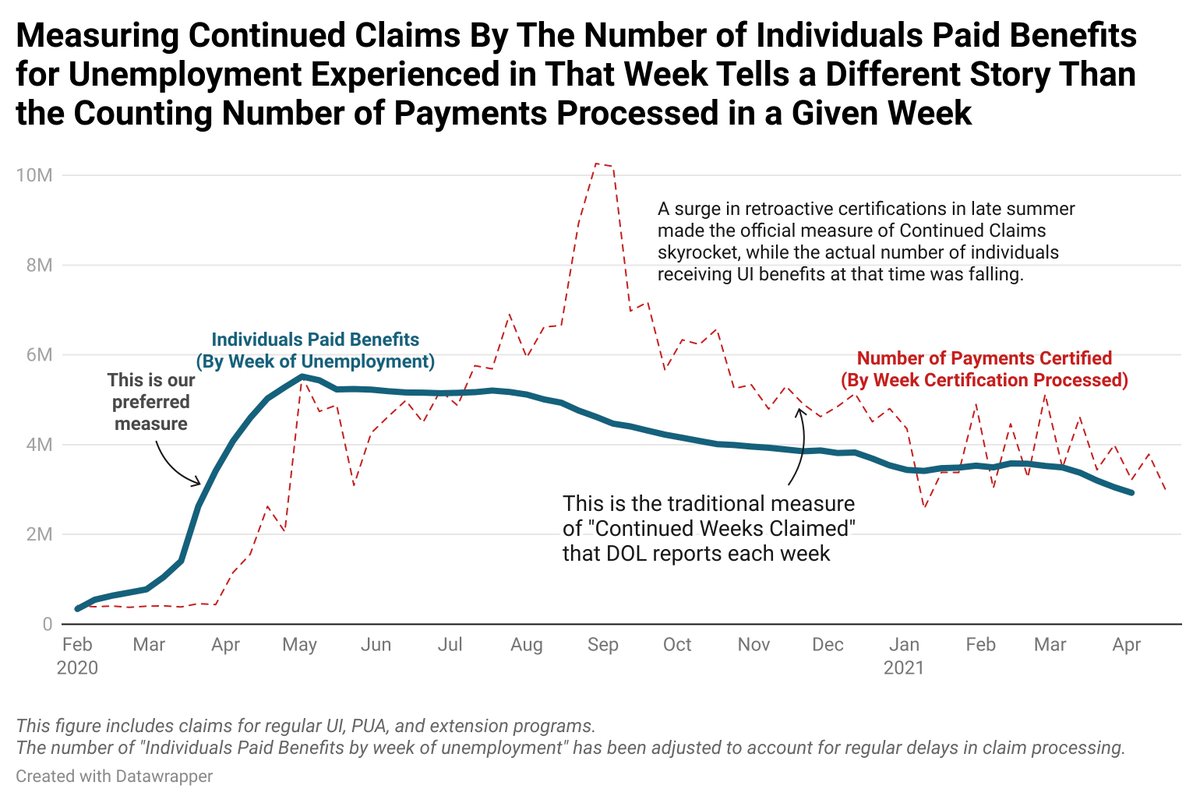
3) The official measure of Continued Claims is sensitive to processing delays + retroactive certifications, making trends difficult to interpret.
CPL's new measure sidesteps these issues by counting individuals paid benefits by the week in which they experienced unemployment.
CPL's new measure sidesteps these issues by counting individuals paid benefits by the week in which they experienced unemployment.
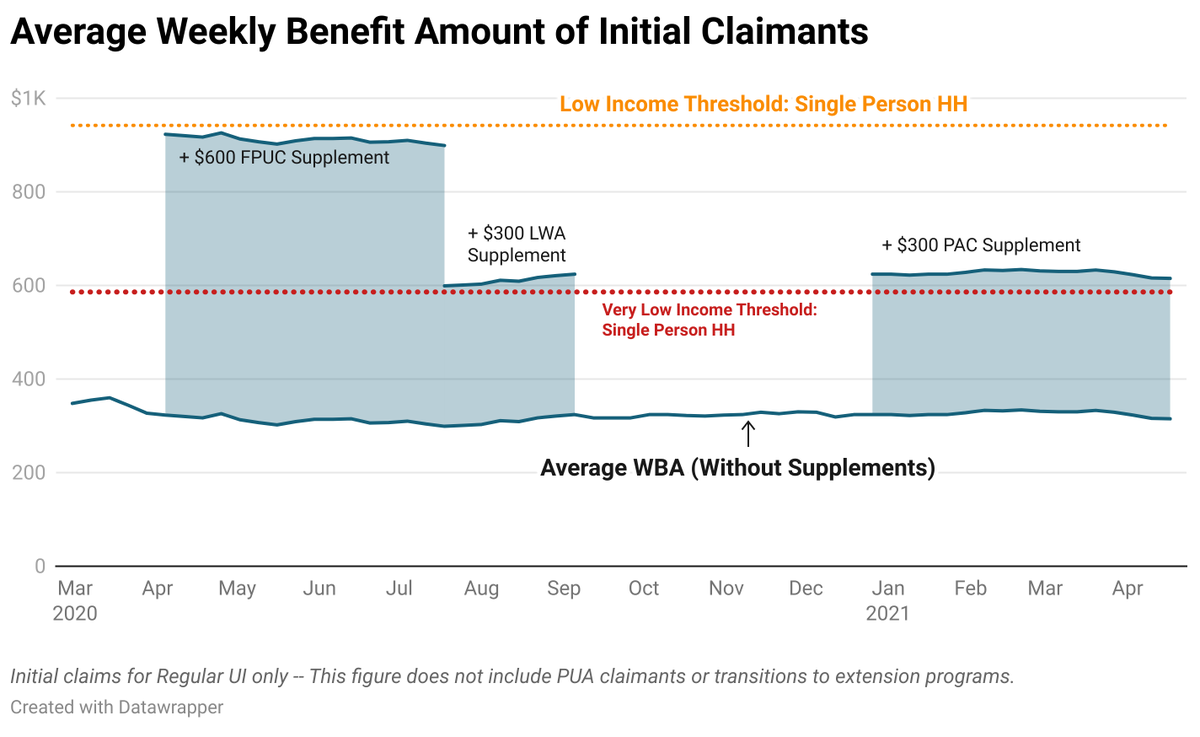
4) The UI system was not designed with low-wage workers in mind. In CA, weekly benefit amounts are just half of prior earnings & top out at $450 - well below poverty levels.
Federal UI benefit supplements were an important lifeline for workers struggling to make ends meet.
Federal UI benefit supplements were an important lifeline for workers struggling to make ends meet.
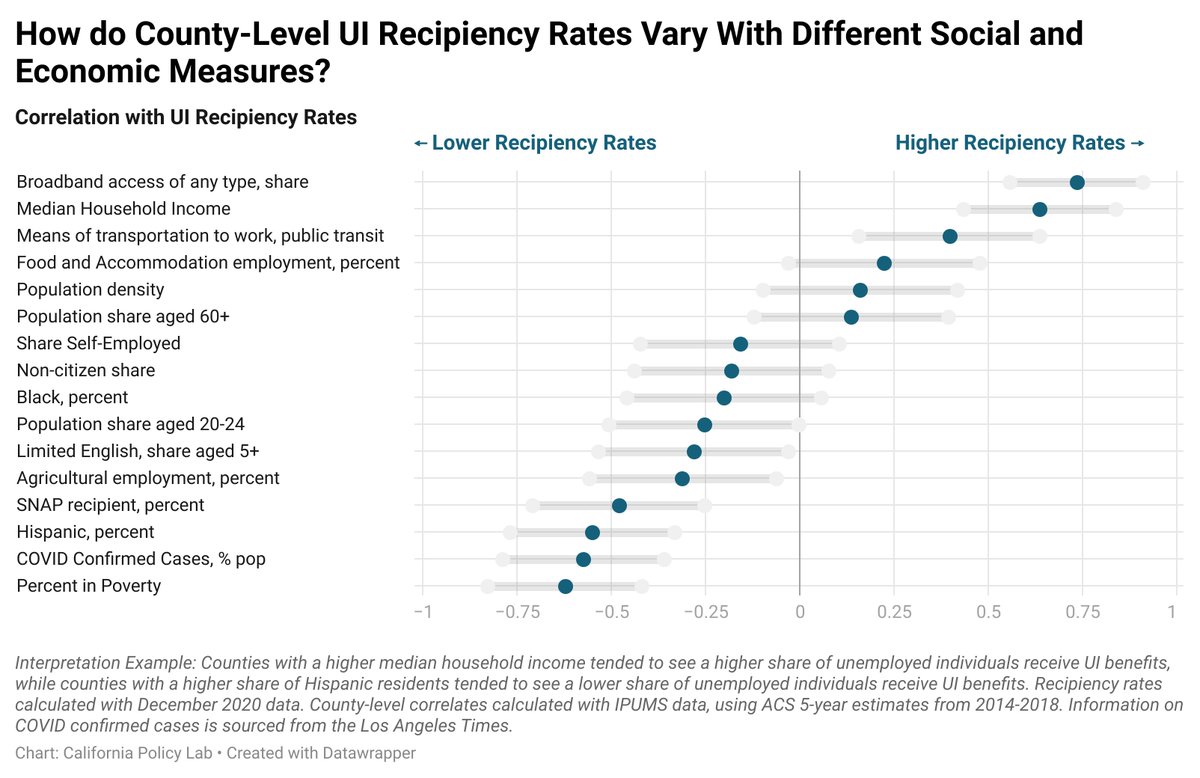
5) The UI recipiency rate (the % of unemployed workers collecting UI benefits) rose substantially during the crisis, and is well above levels seen in past recessions.
But differences between counties were substantial, with lower-income areas less likely to collect benefits.
But differences between counties were substantial, with lower-income areas less likely to collect benefits.
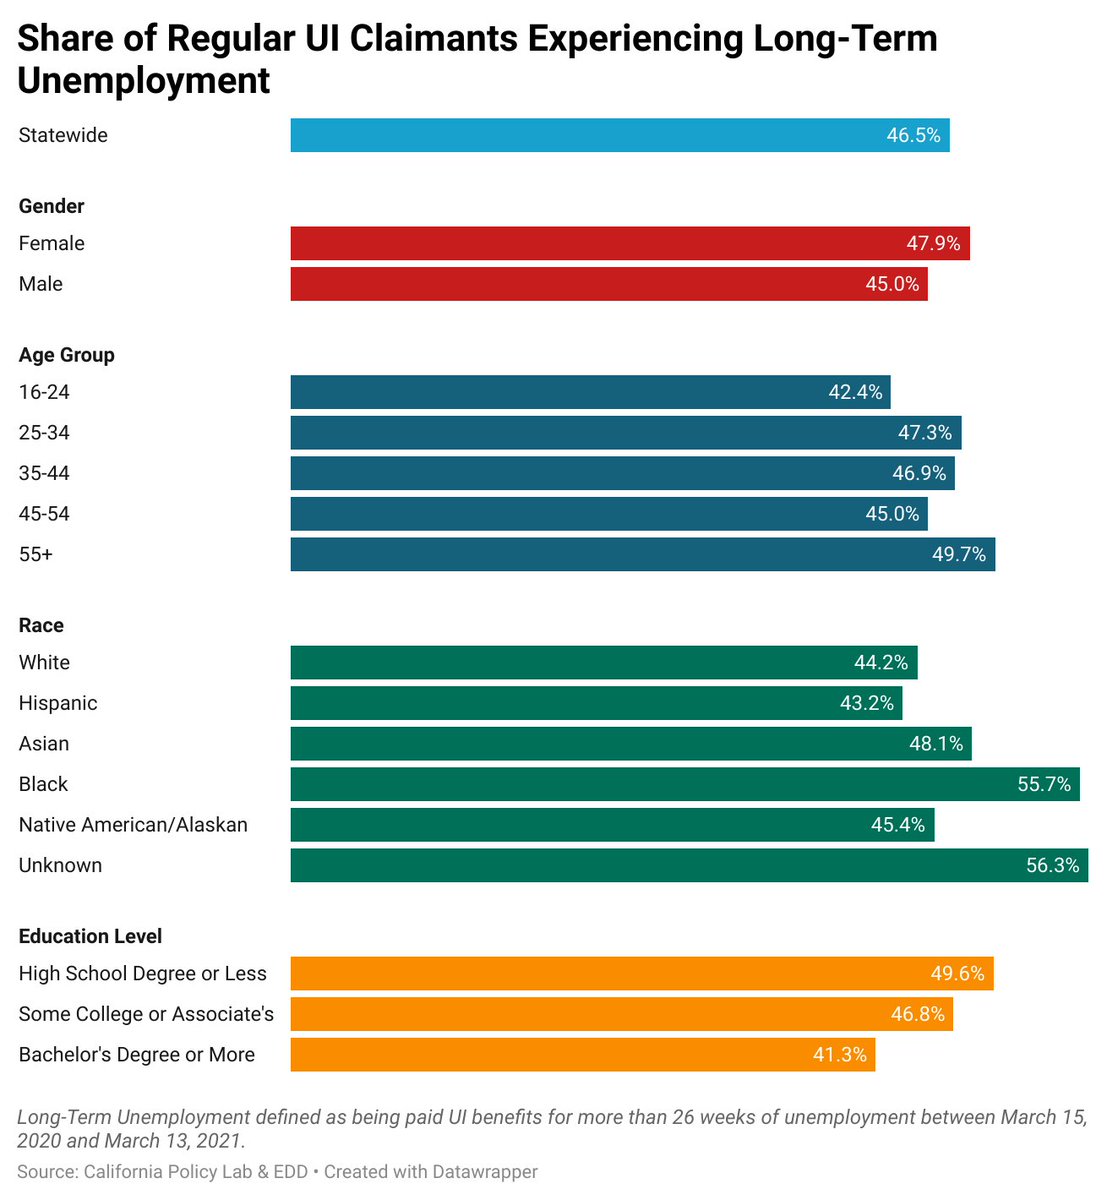
6) Long-term unemployment - which is associated with a myriad of adverse consequences - is an increasingly large problem.
Of the individuals claiming regular UI benefits: Black claimants, lower educated claimants, and female claimants were more likely to experience LTU.
Of the individuals claiming regular UI benefits: Black claimants, lower educated claimants, and female claimants were more likely to experience LTU.
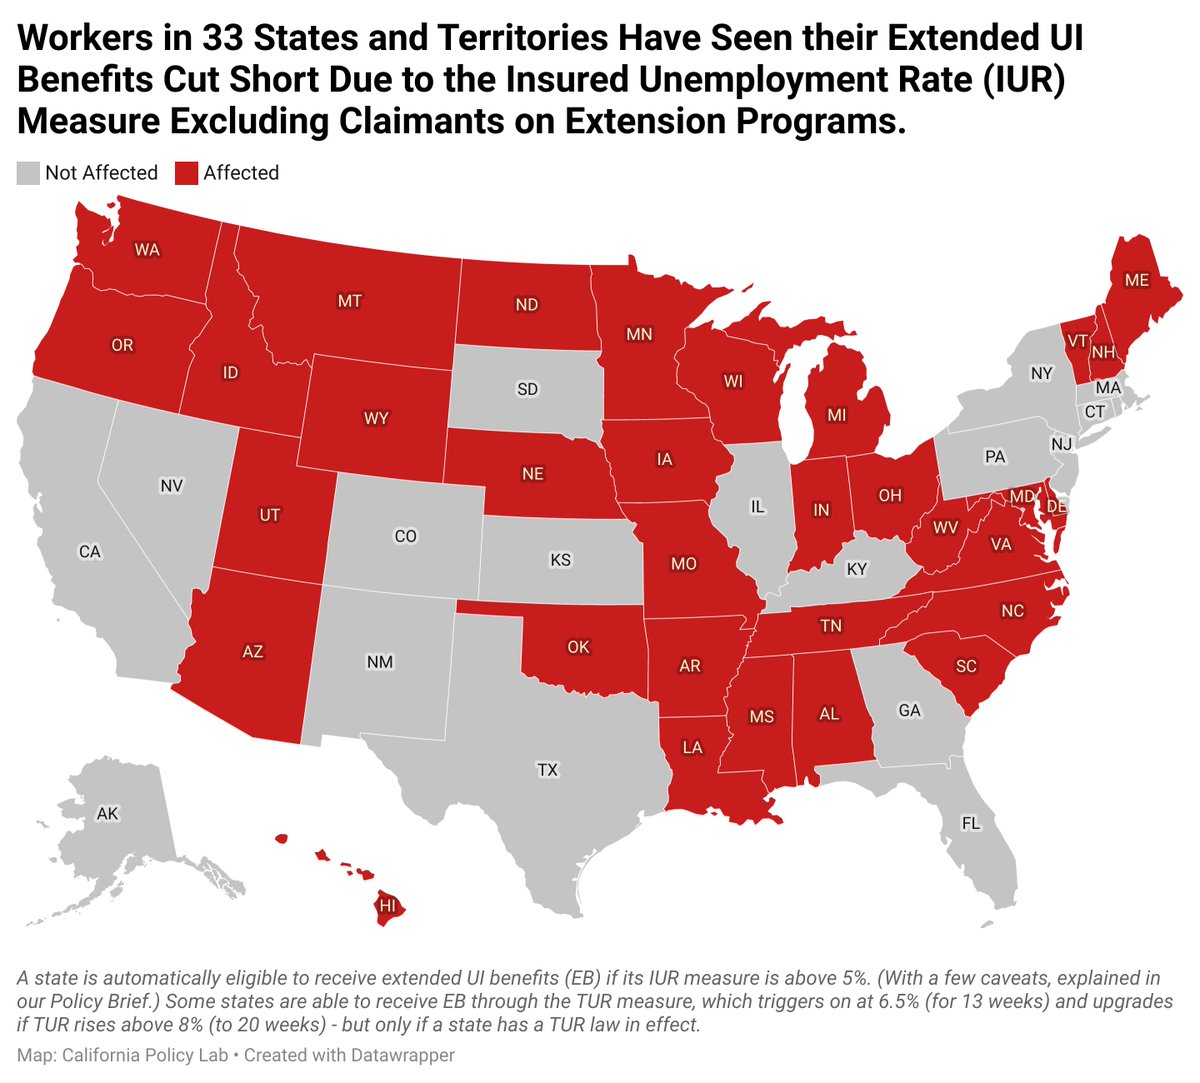
7) The Extended Benefit triggers are broken.
In 33 states, EB has already triggered off because the trigger measure doesn't include claimants on extension programs.
(It's also needed to be adjusted in an ad-hoc fashion in 2/2 of the past recessions.)
In 33 states, EB has already triggered off because the trigger measure doesn't include claimants on extension programs.
(It's also needed to be adjusted in an ad-hoc fashion in 2/2 of the past recessions.)
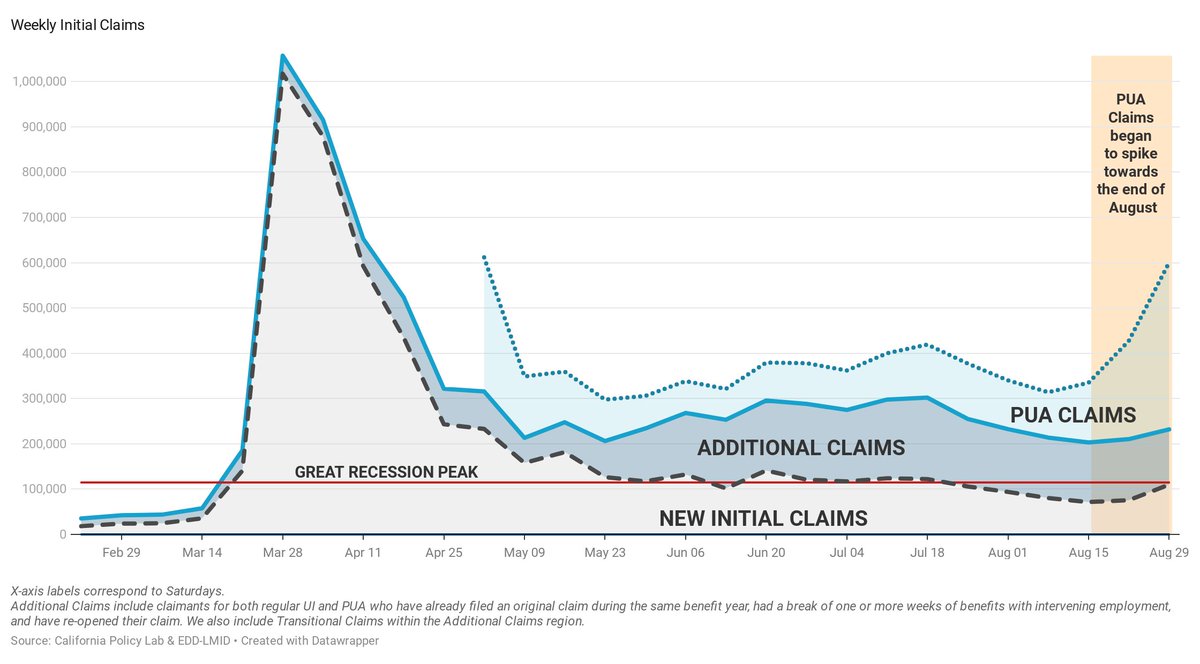
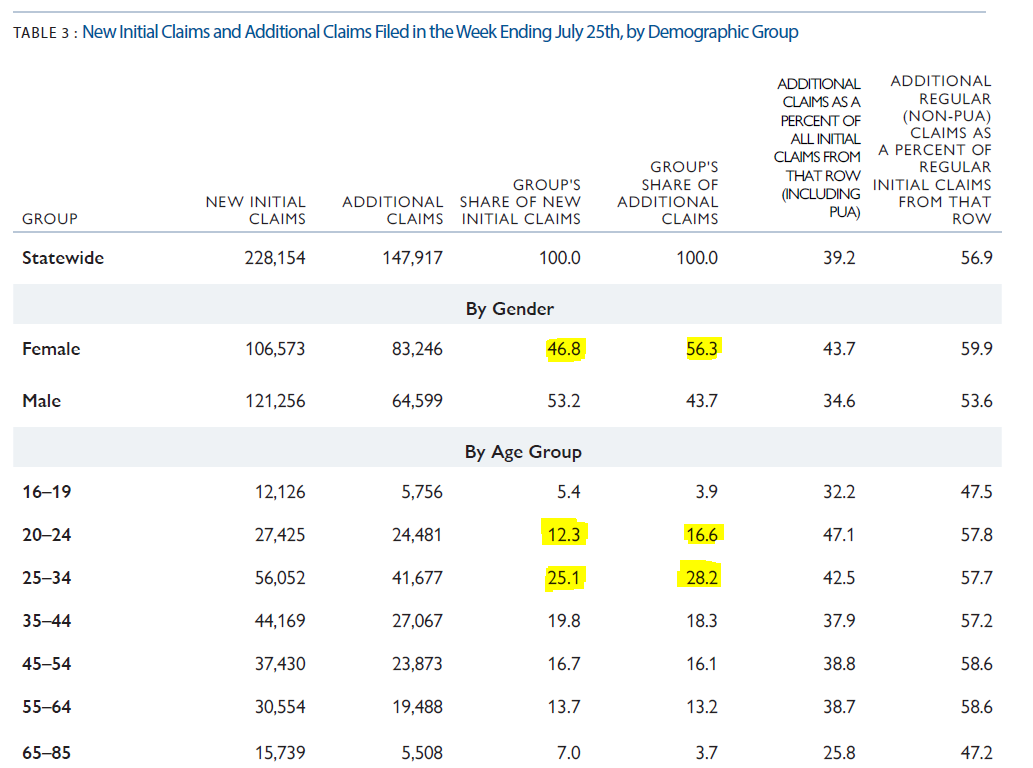
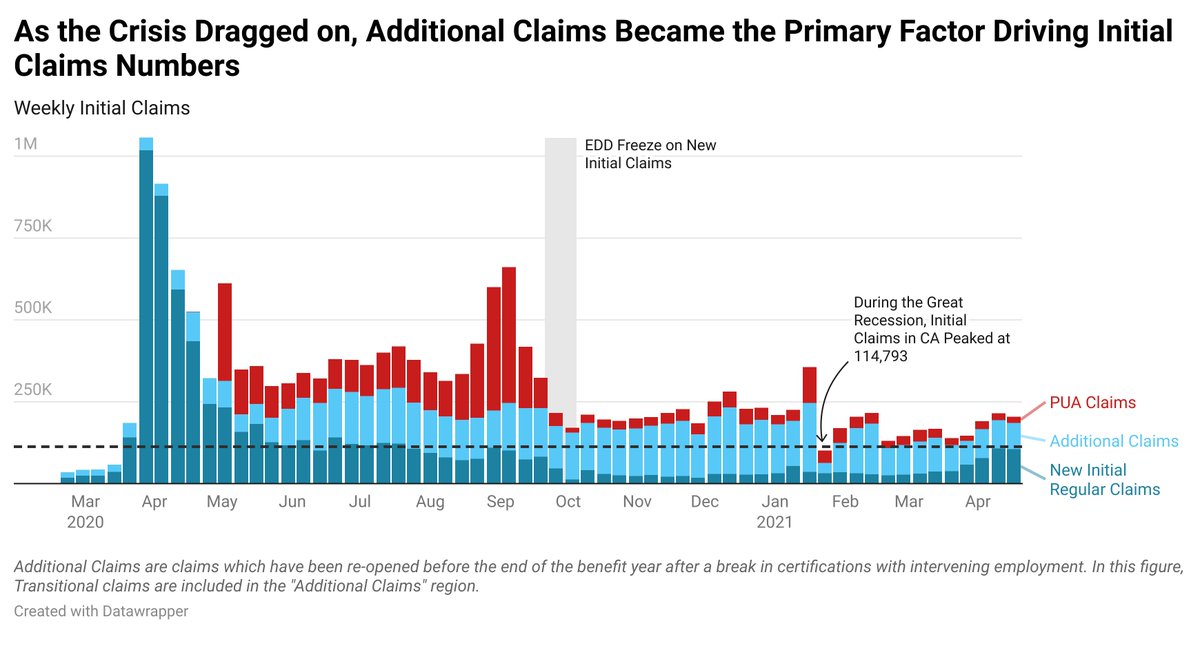
8) Initial claims have remained persistently high throughout the crisis.
One key factor is "Additional Claims", (claims which have been re-opened after a claimant has had a break in certifications with intervening work) which could signal a large amount of churn in the UI system.
One key factor is "Additional Claims", (claims which have been re-opened after a claimant has had a break in certifications with intervening work) which could signal a large amount of churn in the UI system.
9) Many workers saw reduced hours during the crisis instead of complete layoffs - as evidenced by large shares of claimants collecting "Partial UI" benefits.
Hopefully, this means workers & employers have remained connected, and can return to regular employment quickly.
Hopefully, this means workers & employers have remained connected, and can return to regular employment quickly.

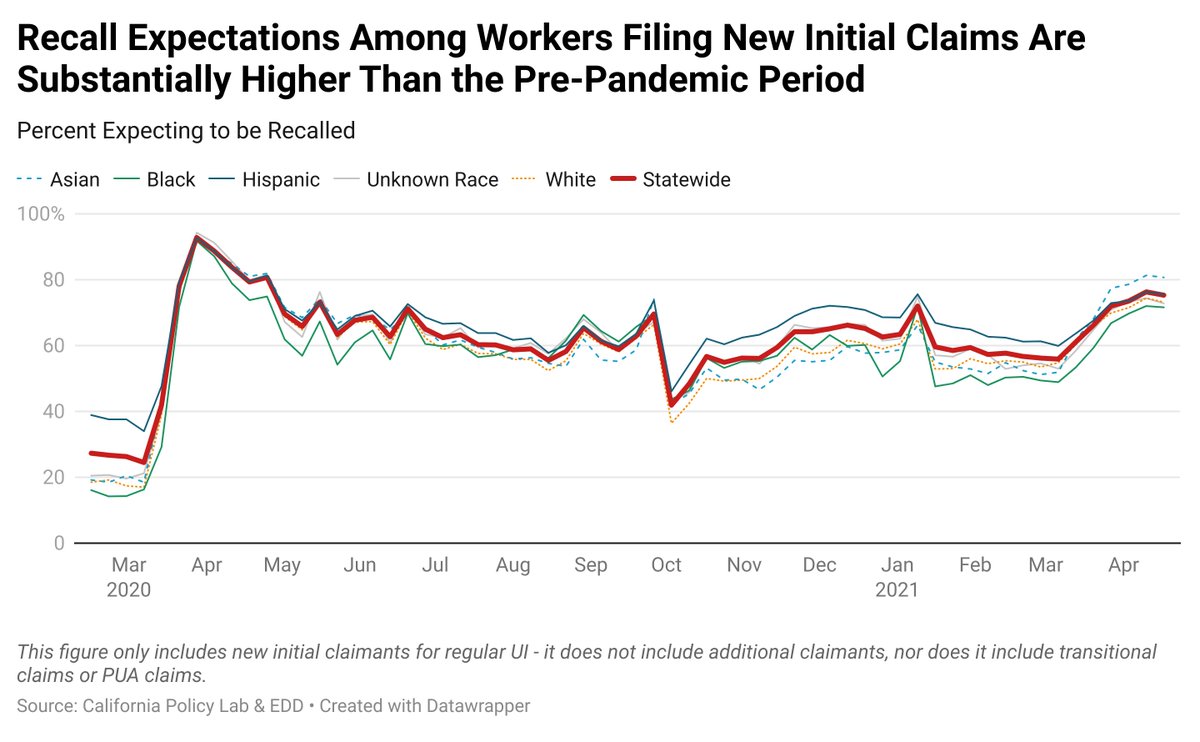
10) Workers were optimistic about their chances of being recalled to their employers during the crisis - much moreso than before the pandemic, & increasingly so in the last 2 months.
The extent to which such recalls actually occur will play a huge role in shaping the recovery.
The extent to which such recalls actually occur will play a huge role in shaping the recovery.
Details on these 10 findings + interactive figures are available here: bit.ly/KeyTrendsUI
After a year of analyzing UI data & navigating the intricacies of the system, we also have a few recs for federal & state policymakers. They're summarized here:
After a year of analyzing UI data & navigating the intricacies of the system, we also have a few recs for federal & state policymakers. They're summarized here:
https://twitter.com/CAPolicyLab/status/1387898578786349058?s=20
cc #EconTwitter
@p_ganong @keds_economist @ernietedeschi @arindube @ENPancotti @paulgp @kevinrinz @hshierholz @claudia_sahm @LipstickEcon @mioana @EvermoreMichele @marthagimbel @JayCShambaugh @DanielBZhao @benzipperer @jc_econ @bencasselman @DianeSwonk
@p_ganong @keds_economist @ernietedeschi @arindube @ENPancotti @paulgp @kevinrinz @hshierholz @claudia_sahm @LipstickEcon @mioana @EvermoreMichele @marthagimbel @JayCShambaugh @DanielBZhao @benzipperer @jc_econ @bencasselman @DianeSwonk
cc:
@aaronsojourner @juliaonjobs @Neil_Irwin @margotroosevelt @TheStalwart @rwest817 @M_C_Klein @AlexSJacquez @danielBZhao @fskhakir @dylanmatt @AngelaHanks @JedKolko
@EmilyRPeck @jimtankersley @MissRyley @sdonnan @ryanlcooper @KateDavidson @RebeccaARainey
@aaronsojourner @juliaonjobs @Neil_Irwin @margotroosevelt @TheStalwart @rwest817 @M_C_Klein @AlexSJacquez @danielBZhao @fskhakir @dylanmatt @AngelaHanks @JedKolko
@EmilyRPeck @jimtankersley @MissRyley @sdonnan @ryanlcooper @KateDavidson @RebeccaARainey
• • •
Missing some Tweet in this thread? You can try to
force a refresh