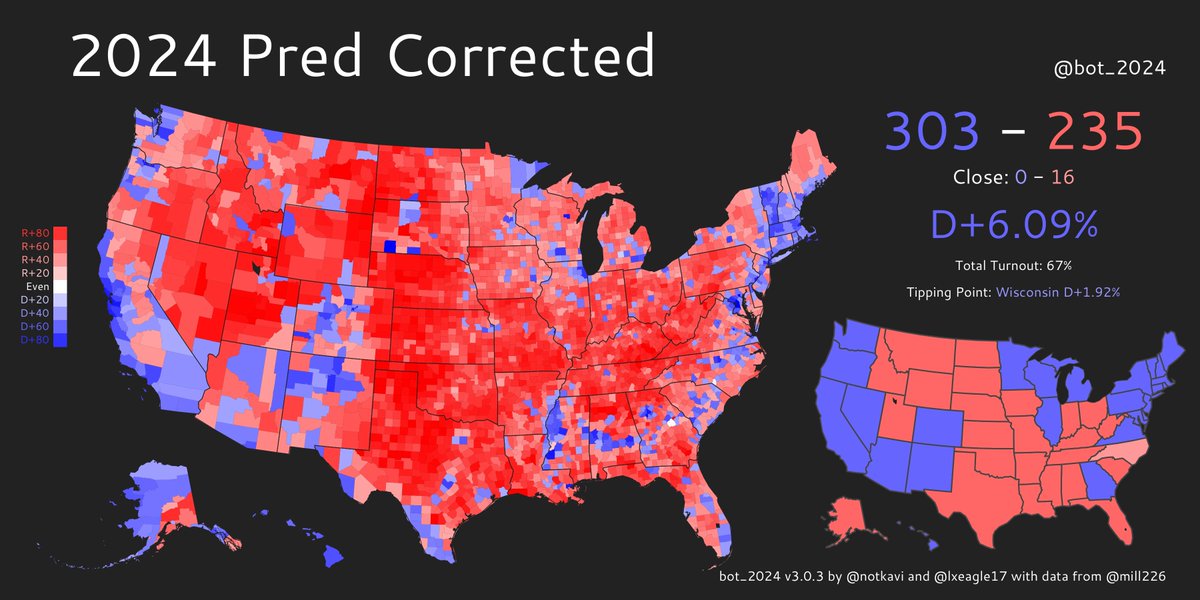
Model update -- @bot_2024 V3.0 is out! @notkavi and I have completely rebuilt it to use more generic data across elections and better model partisanship and turnout on a demographic level, which should give us more interesting and realistic coalitions for 2024. Details in thread! Image
This model projects 2024 demographics from the available 2012, 2016, and 2020 demographic data. It then takes in county-level demographic data for 2012, 2016, and 2020 and uses it to construct underlying demographic features for the electorate.
We use pretty interesting demographic features commonly available across the 2012/2016/2020 electorates, such as CVAP with racial breakdown, poverty, income, religion, and education. That also helps us get more information about what's happening with the underlying electorate.
The model uses a (simple!) neural network to carve the electorate up into a latent "demographic space" on a per-county basis before predicting the turnout and partisanship per demographic and uses that to compute county partisanship.
The model is trained on the swings in each county from 2008->2012, 2012->2016, and 2016->2020. We perturb the model's predictions to get different maps for 2024, showcasing a variety of unique and plausible coalitions.
It is important to note that in predicting 2024, we center the model around the partisanship per "hidden" demographic, but we use a weighted average of the 2012/2016/2020 turnouts, because we do not know what turnout will look like and have no reason to prefer any scenario.
Here's how the model predicted 2012 based on underlying demographic data. In the residuals, you'll see Obama's incredibly significant overperformances in Ohio and Iowa -- this is the type of stuff legends are made of. ImageImage
This is how it thinks 2016 should have gone. The midwest isn't all that surprising, actually, in hindsight. We just lost it badly in Michigan, where Democrats didn't turn out at all. I'd ignore Miami-Dade listed as a Trump overperformance -- we don't have a "Cubans" variable ImageImage
Lastly, here is 2020, with Biden's overperformances in New England, upper Michigan, and several sunbelt suburbs being the most significant things for Democrats. Trump, meanwhile, smashed through expectations in Ohio, Iowa, and Florida. ImageImage
We also added a legend and state lines, per request. Anyways, hope you like this! @notkavi has restructured the codebase three times by now in the course of writing this, and I am a bit sick of looking at census data and writing scripts to aggregate and parse it by this point.
You can read more at the github here if you are interested. github.com/kavigupta/2024…

go bears

• • •

Missing some Tweet in this thread? You can try to force a refresh
 

Keep Current with Lakshya Jain

Lakshya Jain Profile picture

Stay in touch and get notified when new unrolls are available from this author!

Read all threads

This Thread may be Removed Anytime!

PDF

Twitter may remove this content at anytime! Save it as PDF for later use!

Try unrolling a thread yourself!

how to unroll video
  1. Follow @ThreadReaderApp to mention us!

  2. From a Twitter thread mention us with a keyword "unroll"
@threadreaderapp unroll

Practice here first or read more on our help page!

More from @lxeagle17

25 Apr
Come on. Not every nation has the resources to do what the United Stares can. As a world leader, it’s incumbent upon the USA to help those in need, especially because their safety and ours are so intertwined.
India, Brazil, and other poorer nations literally do not have the resources to fund and purchase 600M extra doses and leave them sitting in ultra-cold storage. This is where countries need a hand up more than ever.
Screenshot cuz it’s gone.
Read 4 tweets
21 Apr
Strange to see the replies to @bot_2024. Some insist 2024 could be an R+2 year, but then dismiss the possibility of a D+10 year in the same breath. But both basically consist of parties getting electoral reversion with one demographic while accelerating their gains with another.
There's more evidence for Hispanics reverting than there is for white suburbanites doing so, but it's still not prudent for Democrats to toss Hispanic reversion around as a given. It's not! That's why Biden's approval rating staying high with Hispanic voters is so important.
With regards to white suburbanites and the GOP, I honestly don't think the GOP has shown that they're intent on doing anything but doubling down on the Trump electoral strategy any time soon. So no, I don't find that scenario likely right now unless they nominate Charlie Baker.
Read 4 tweets
13 Apr
What happens if you project the 2020 electorate onto a midterm?

Here's the 2020 electorate for a variety of swing states projected across the last 4 midterms. The blue wave of 2006 being worse in a geographic projection than the 2010 red wave shows the realignment quite starkly.
Geographic projections miss the individual voter shift, but are a correlate of that effect, so it's an okay first-order approximation. Dem midterm edge among educated voters is clearest in Georgia, where the GOP base relies disproportionately on non-college whites.
Additionally, the explosive growth of metro areas in Georgia, Texas and North Carolina, combined with population loss in the rurals, might actually show an overly-friendly GOP edge in the older midterm years in those states.
Read 6 tweets
12 Apr
Lot of misconceptions about who HR-1 benefits with higher voter turnout.

Here's a simple regression of how a county's turnout change from 2012 (as a % of 2012 votes) correlates with 2020 Democratic margin (weighted by votes cast). Not *at all* clear that the GOP is hurt by this.
I'm sharing this with caution because of ecological fallacy risk; we don't know who is the surge voter from this regression. I'm just trying to see if there's an obvious correlation about which party gains with higher turnout in presidential years benefits. I can't see any.
This is actually suggesting that there is an ever-so-slight correlation between higher turnout and a small Republican lean, but I really don't feel comfortable drawing that conclusion given that the granularity of the data points is only at a county level. Use this with caution.
Read 5 tweets
11 Apr
To summarize how bad of a candidate Rick Santorum is, he's one of the very few politicians who managed to turn incumbency into a large disadvantage.
How this man thought he could ever run for President and win, I truly do not know, but never doubt the hubris of a DC politician surrounded by lobbyists.
nothing in particular sparked this tweet I just think any time is a good time to laugh at Rick Santorum
Read 4 tweets
11 Apr
🚨MODEL DROP🚨: @notkavi and I have built a model (@bot_2024) that will provide a host of possible 2024 maps based on demographics, coalitions, the continuation/reversal/acceleration of differing trends, and varying national environments. It will tweet one map a day.
We estimate demographics by taking ACS estimates and projecting 2024 totals based on demographic trends. Electoral vote totals are per @270toWin’s estimate of reapportionment after the census. Close states (<0.5% margin) are made a lighter shade of the winning party's color.
By perturbing specific feature weights, we (largely) preserve county correlations, which should avoid some ridiculous maps. The purpose of the exercise is not to predict, but to showcase a range of scenarios on what 2024 could look like.
Read 7 tweets

Did Thread Reader help you today?

Support us! We are indie developers!


This site is made by just two indie developers on a laptop doing marketing, support and development! Read more about the story.

Become a Premium Member ($3/month or $30/year) and get exclusive features!

Become Premium

Too expensive? Make a small donation by buying us coffee ($5) or help with server cost ($10)

Donate via Paypal Become our Patreon

Thank you for your support!

Follow Us on Twitter!