1/ I’ll reiterate what I said about this dataset a few weeks ago. You should take this data with a huge grain of salt (though not necessarily dismiss it ENTIRELY), because of one warning sign you can see below: radical discontinuities along state lines.
2/ Here’s how this data was constructed: they surveyed a whole lot of people about vaccine hesitancy, and then they used demographic characteristics of those people to extrapolate to the entire population. Relatively standard technique, but with some obvious pitfalls.
3/ Here are the variables HHS used in their model: "age, gender, race/ethnicity, education, marital status, health insurance status,
household income, state of residence, and interaction terms between race/ethnicity and having a college degree."
4/ You’ll notice that one of those factors is “state of residence.” That is, if residents of a particular state, such as Minnesota, were unusually likely to tell the original poll they wanted a vaccine, the model treated “being from MN” as a factor associated with pro-vax views.
5/ The idea that MN is more pro-vax overall than its neighbors is plausible. But the idea that rural counties in NW MN are drastically more pro-vax than their neighbors right across the Red River in ND? That should give you pause.
6/ Additionally, while this map is on the county level, the actually data is on the level of the “Public Use Microdata Area,” a little-known Census geography of around 100K people each; in rural areas it’s groups of counties, in urban areas it follows city/neighborhood lines.
7/ I said take this model with a grain of salt, not dismiss it entirely. So what CAN you use?

1. The data at the state level is almost certainly more reliable than on the sub-state level. Here’s a chart I made showing vaccine hesitancy rates (when it was done in March)
8/ Second, if you want to use data at the sub-state level — the principal appeal of this dataset! — then look at the data only within a single state, since state lines are a distorting variable here). And focus less on the absolute values of hesitancy than on relative levels.
9/ If you’re interested in my original analysis of this data from April 14, I wrote about it in my @MPRnews #COVID19 newsletter: view.connect.mpr.org/?qs=acb5804de0…
@MPRnews 10/10 And if you want more analysis like this of #COVID19 data, especially as it relates to Minnesota, subscribe to my newsletter here! cloud.connect.mpr.org/mprnews_covid

• • •

Missing some Tweet in this thread? You can try to force a refresh
 

Keep Current with David H. Montgomery

David H. Montgomery Profile picture

Stay in touch and get notified when new unrolls are available from this author!

Read all threads

This Thread may be Removed Anytime!

PDF

Twitter may remove this content at anytime! Save it as PDF for later use!

Try unrolling a thread yourself!

how to unroll video
  1. Follow @ThreadReaderApp to mention us!

  2. From a Twitter thread mention us with a keyword "unroll"
@threadreaderapp unroll

Practice here first or read more on our help page!

More from @dhmontgomery

3 May
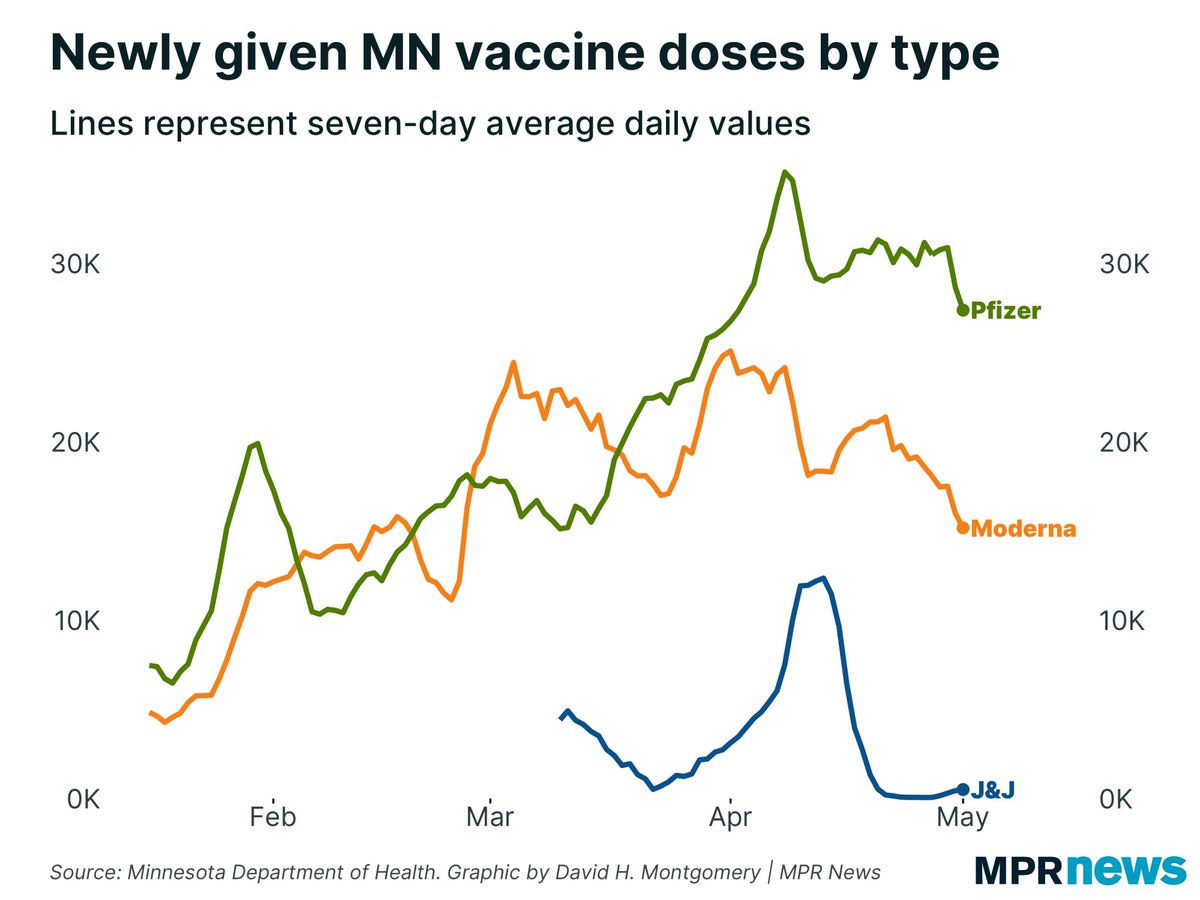
Today’s #COVID19 news in Minnesota is not great. The number of newly administered first doses is plummeting. I actually think the current levels are artificially low — we’ve been getting an average of 20K 1st doses per day — and due for a bounceback, but this isn’t good.
At the current pace, it’d take until late June to give 80% of Minnesotans their first vaccine.

A few weeks ago, we were chugging along at a mid-May pace.
J&J doses are starting to be given again, but only in relatively small numbers. Now Pfizer and Moderna doses are starting to decline, too.
Read 10 tweets
2 May
What precisely is the specific allegation in the sign, “Why won’t the gov[ernment] let black ppl make up more than 13% of the U.S. pop?”?

Activists regularly accuse the government of killing Black people. But this is a very specific demographic figure.
In the 1990 Census, 12.1% of Americans were Black. In 2000, it was 12.3%. In 2010, it was 12.6%.

We don’t have figures for the 2020 Census yet. The 2019 ACS one-year estimate was 12.8% Black.
To be clear, I’m genuinely curious as to the intent here. Is this a more poetic way of repeating the more common charge about Black deaths at the hand of the government? Is there a conspiracy theory about 13% as a threshold? It’s very specific and very demographic.
Read 4 tweets
26 Apr
Via @BitsyPerlman, here’s a fascinating redistricting idea I hadn’t encountered before, called “Primary Allocation.” Seats are allocated to parties proportionally via a statewide election. Then each party divides the state into districts for their reps… fordham.edu/download/downl…
@BitsyPerlman First, that’s fascinating to reverse the order of the primary and general elections — the “general” comes first to allocate seats, then the “primary” comes second to choose who fills them! Not sure if that’s better or not, but it’s counterintuitive and I like that.
@BitsyPerlman Second, it gets at two competing impulses in electoral system design: that results ought to be roughly proportional to the population, and that everyone should have “their” representatives.
Read 4 tweets
26 Apr
Minnesota will NOT LOSE A SEAT
Huge upset — Minnesota was expected to lose a seat because other states grew more quickly, but it looks like it just squeaked in!
Big winners here: @michellefischb and @PeteStauber.
Read 7 tweets
26 Apr
In about 15 minutes, we’ll find out whether Minnesota is going to lose one of its 8 congressional seats for the next decade. Many experts expect MN *will* lose a seat, but we’re on the cusp. Stay tuned, I’ll be tweeting out the news and writing it up later for @MPRnews.
@MPRnews Note that the fact that some states will lose seats as a result of the Census is not in the constitution. A law fixed the size of the House at 435 members. In the 19th Century, the House tended to get more members each decade, instead of reapportioning a fixed sum.
@MPRnews First we need to wade through preliminary remarks before everyone finds out the apportionment numbers…
Read 6 tweets
26 Apr
As of today, Minnesota’s average #COVID19 positivity rate is 4.97%.

That’s the first time it’s been under the 5% warning line since March 29. It comes after 11 straight days of improvement.
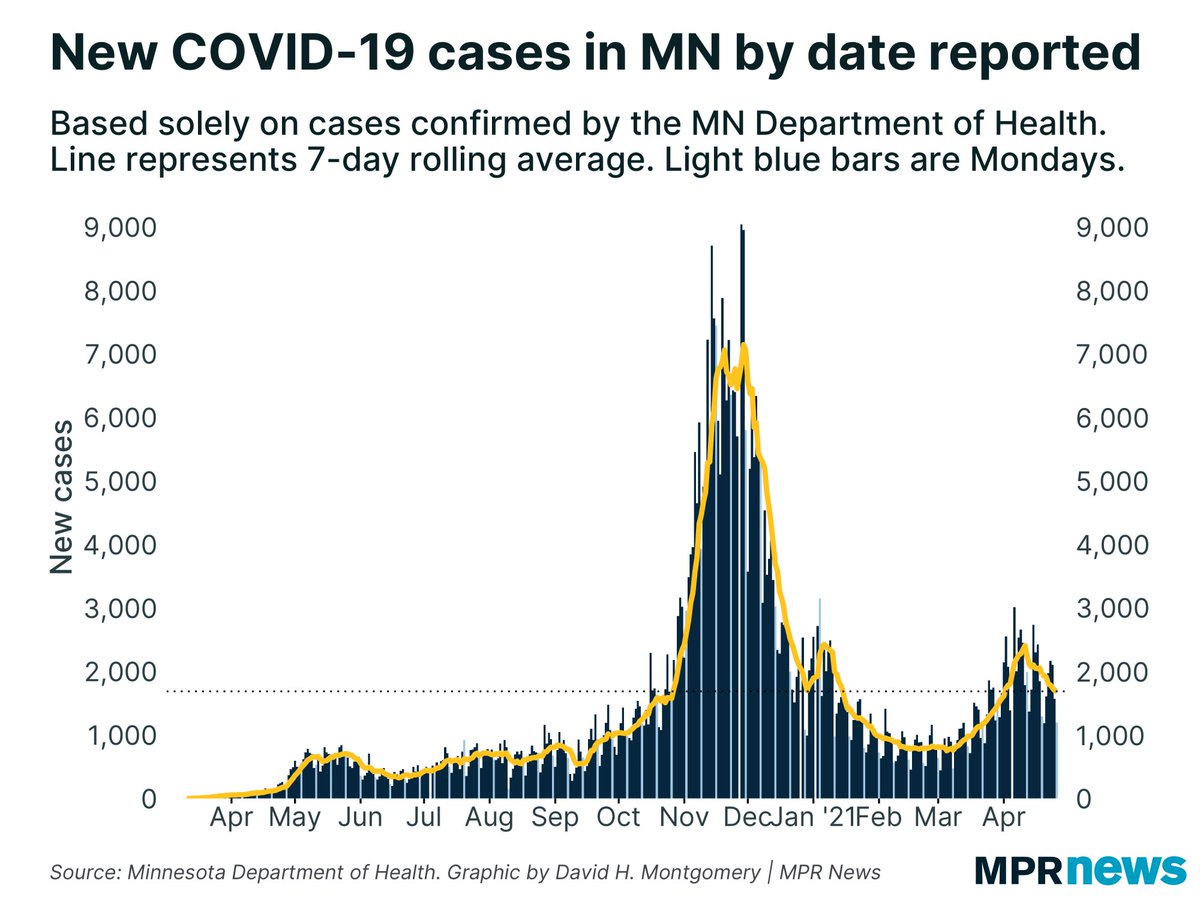
Minnesota’s now down to an average of just under 1,700 newly reported #COVID19 cases per day, compared to more than 2,100/day two weeks ago.

Active, confirmed cases are down to just over 15,000, from a peak over 20K.
Unless there’s a data error on @mnhealth’s website, today Minnesota reported 0 new #COVID19 deaths for the first time since March 22, and only the 2nd time since last April.
Read 10 tweets

Did Thread Reader help you today?

Support us! We are indie developers!


This site is made by just two indie developers on a laptop doing marketing, support and development! Read more about the story.

Become a Premium Member ($3/month or $30/year) and get exclusive features!

Become Premium

Too expensive? Make a small donation by buying us coffee ($5) or help with server cost ($10)

Donate via Paypal Become our Patreon

Thank you for your support!

Follow Us on Twitter!