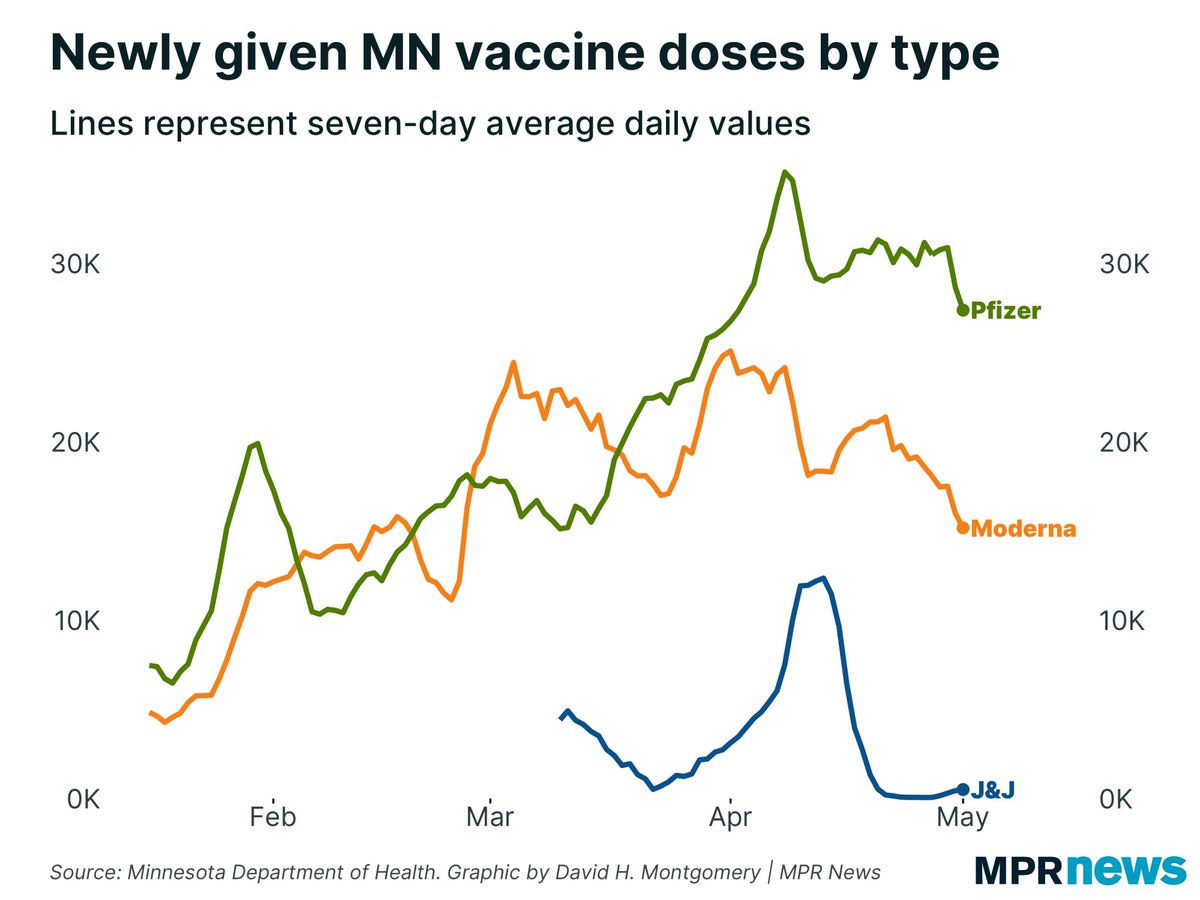
Today’s #COVID19 news in Minnesota is not great. The number of newly administered first doses is plummeting. I actually think the current levels are artificially low — we’ve been getting an average of 20K 1st doses per day — and due for a bounceback, but this isn’t good.
At the current pace, it’d take until late June to give 80% of Minnesotans their first vaccine.
A few weeks ago, we were chugging along at a mid-May pace.
J&J doses are starting to be given again, but only in relatively small numbers. Now Pfizer and Moderna doses are starting to decline, too.
Vaccination rates are declining in all age groups and all regions of Minnesota.
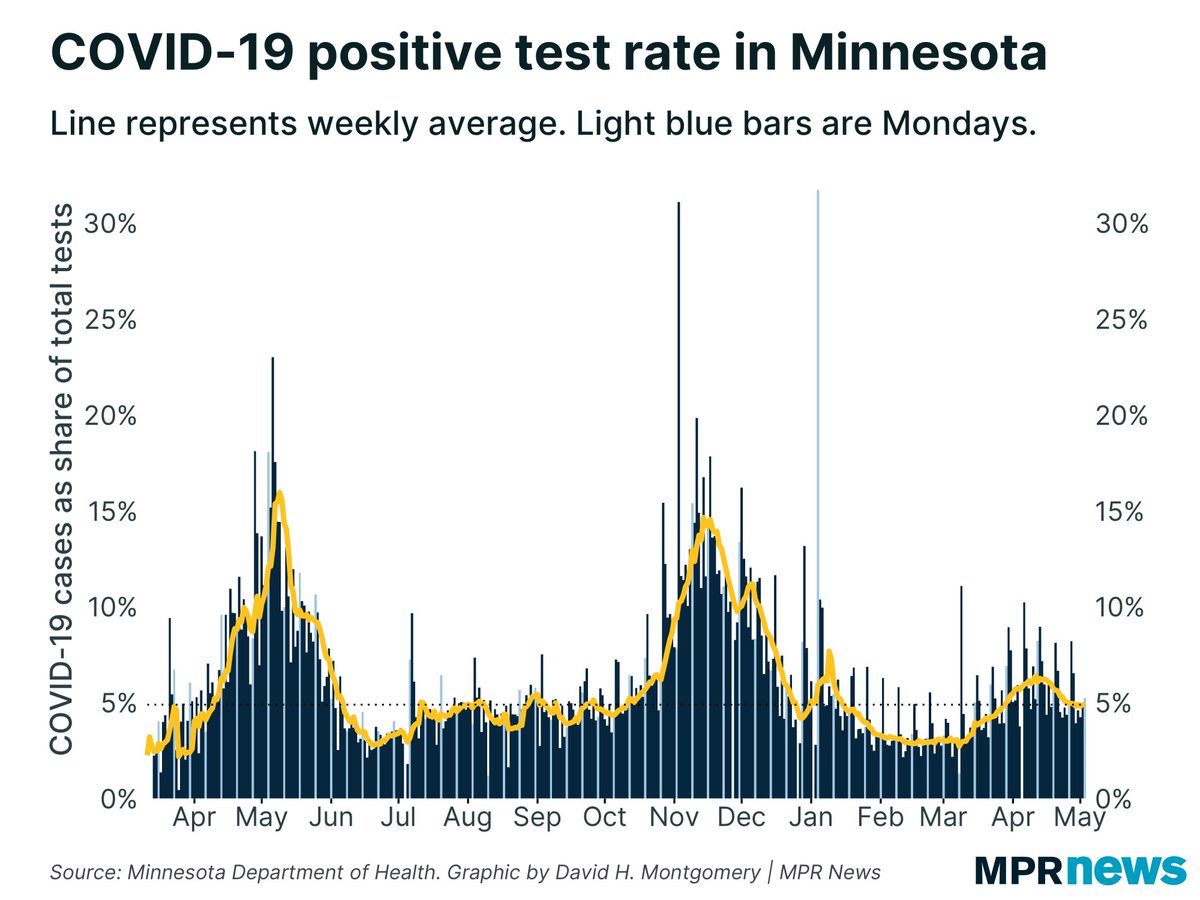
Meanwhile, Minnesota’s weeks-long improvement from its third #COVID19 wave might be stalling out. Positivity rate is plateauing around 4.9%, rather than continuing to decline to the 3% levels we saw a few months ago.
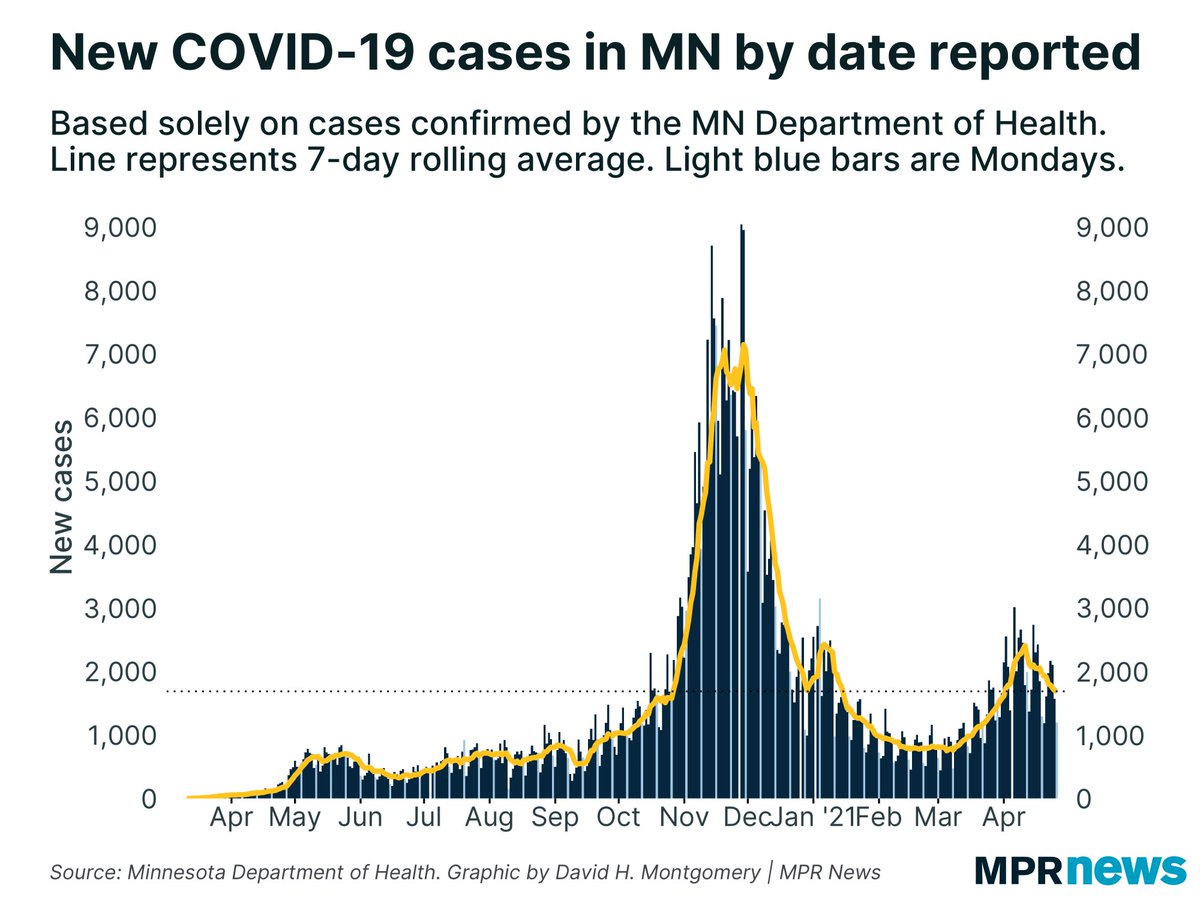
Cases have continued to decline, but some of that is due to lower testing volume. Cases identified in last Monday’s testing were only fractionally lower than the Monday prior, after a few weeks of more significant drops.
Hospitalization data is still mostly trending down, but continues to be noisy.
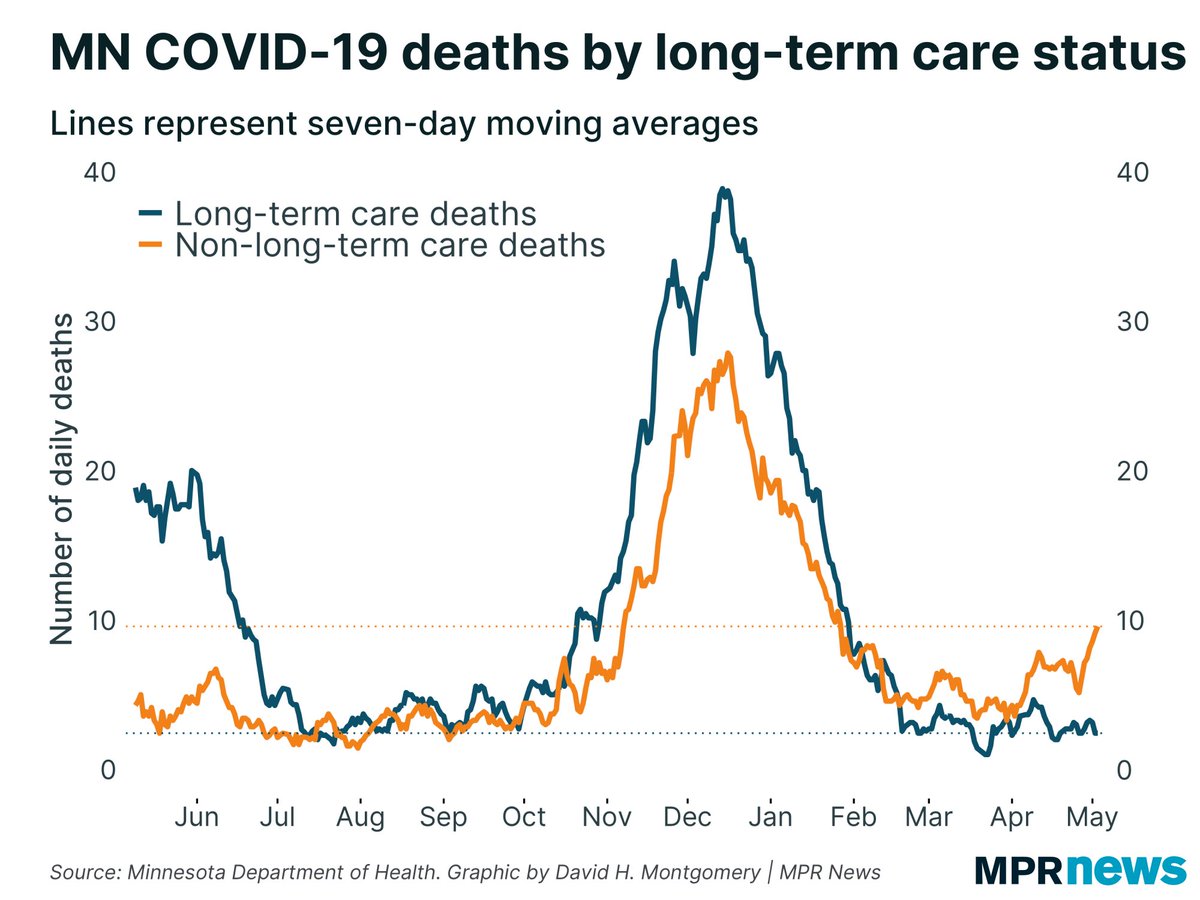
There’s also, I think, increasingly strong evidence that we are seeing a moderate death spike from third wave cases. With nursing home residents mostly vaccinated, this is happening largely in the general population.
To be clear, all this not-great #COVID19 news needs to be taken in context. Case growth is plateauing at 4.9% positivity, not 8%. Vaccinations are falling, but 60% of eligible Minnesotans already have 1+ shot — better than plateauing at a lower level.
Also, I will push back on everyone attributing Minnesota’s decline in vaccination rates to vaccine hesitancy/lack of demand. While that is certainly playing a part here, most evidence suggests this is mostly still supply-driven — vaccination rates closely track doses shipped.
• • •
Missing some Tweet in this thread? You can try to
force a refresh
1/ I’ll reiterate what I said about this dataset a few weeks ago. You should take this data with a huge grain of salt (though not necessarily dismiss it ENTIRELY), because of one warning sign you can see below: radical discontinuities along state lines.
2/ Here’s how this data was constructed: they surveyed a whole lot of people about vaccine hesitancy, and then they used demographic characteristics of those people to extrapolate to the entire population. Relatively standard technique, but with some obvious pitfalls.
3/ Here are the variables HHS used in their model: "age, gender, race/ethnicity, education, marital status, health insurance status,
household income, state of residence, and interaction terms between race/ethnicity and having a college degree."
In the 1990 Census, 12.1% of Americans were Black. In 2000, it was 12.3%. In 2010, it was 12.6%.
We don’t have figures for the 2020 Census yet. The 2019 ACS one-year estimate was 12.8% Black.
To be clear, I’m genuinely curious as to the intent here. Is this a more poetic way of repeating the more common charge about Black deaths at the hand of the government? Is there a conspiracy theory about 13% as a threshold? It’s very specific and very demographic.
Via @BitsyPerlman, here’s a fascinating redistricting idea I hadn’t encountered before, called “Primary Allocation.” Seats are allocated to parties proportionally via a statewide election. Then each party divides the state into districts for their reps… fordham.edu/download/downl…
@BitsyPerlman First, that’s fascinating to reverse the order of the primary and general elections — the “general” comes first to allocate seats, then the “primary” comes second to choose who fills them! Not sure if that’s better or not, but it’s counterintuitive and I like that.
@BitsyPerlman Second, it gets at two competing impulses in electoral system design: that results ought to be roughly proportional to the population, and that everyone should have “their” representatives.
In about 15 minutes, we’ll find out whether Minnesota is going to lose one of its 8 congressional seats for the next decade. Many experts expect MN *will* lose a seat, but we’re on the cusp. Stay tuned, I’ll be tweeting out the news and writing it up later for @MPRnews.
@MPRnews Note that the fact that some states will lose seats as a result of the Census is not in the constitution. A law fixed the size of the House at 435 members. In the 19th Century, the House tended to get more members each decade, instead of reapportioning a fixed sum.
@MPRnews First we need to wade through preliminary remarks before everyone finds out the apportionment numbers…
As of today, Minnesota’s average #COVID19 positivity rate is 4.97%.
That’s the first time it’s been under the 5% warning line since March 29. It comes after 11 straight days of improvement.
Minnesota’s now down to an average of just under 1,700 newly reported #COVID19 cases per day, compared to more than 2,100/day two weeks ago.
Active, confirmed cases are down to just over 15,000, from a peak over 20K.
Unless there’s a data error on @mnhealth’s website, today Minnesota reported 0 new #COVID19 deaths for the first time since March 22, and only the 2nd time since last April.