Spain's (surely everywhere's) limits for Covid Incidence Rate are purely arbitrary, and politically decided to be impossible to accomplish.
They are SIX TIMES LOWER than scientifically calculated values.
What we considered NO RISK, basal phase, becomes MEDIUM (3/5) RISK in CV.
I finally could find the Epidemic Threshold for Influenza Like Illnesses.
It's defined by a serious study based in historical AND regional data relating Incidence Rate and hospital outcomes.
A useful tool too understand when epidemic occurs and extra attention should be paid.
Opposing arbitrary WORLDWIDE Covid monolithic criteria, it settles different statistical values for each region
Basal phase limit varies between 33-125 cases/100K a week.
It makes sense, Spain is complex, from Continental Castile to tropical Canarias.
In the other hand, Covid so-called science is childish and arbitrary.
It settles 5 risk frames, being the New Normal (no Epidemic basal phase) lesser than 10, and the rest (25, 75, 125) political ROUND numbers, unrelated to any Reality.
But they completely RULE our lifes.
If we compare SCIENTIFICAL and Covid criteria we observe that what we considered NOT CONCERNING with science has become MEDIUM RISK.
Monday normality will be HIGH RISK for 3 regions under Covid madness
Canarias historic Normal would be HIGH RISK today, maximum alert level
The limit of 10 to go back to New Normal is, national average, six times lower than what we scientifically knew was the true limit for even calling it Epidemic.
For Canarias it's more than TWELVE TIMES LOWER, a pure nonsense.
Limits chosen to be impossible to accomplish.
There's no reason to keep obeying antiscientifical rules, with political impossible to accomplish limits.
We have to demand science back again.
We can't live in this harmful fantasy anymore.
• • •
Missing some Tweet in this thread? You can try to
force a refresh
Los límites a la Incidencia Acumulada que nos imponen para volver a la normalidad son ANTICIENTÍFICOS, ARBITRARIOS e IMPOSIBLES DE CUMPLIR.
Su valor es SEIS veces más bajo que lo conocido por la Ciencia.
El Umbral de peligro Epidémico era de casi 60 casos/100K en tasa semanal.
El método se puede encontrar en los informes del RENAVE y es un estudio de las series históricas de la epidemia de virus respiratorios (sí, TAMBIÉN los coronavirus) para cada región, puesto que hay grandes diferencias en el complejo clima español.
Determina el límite REAL, sobre datos históricos, en el que la incidencia se observa epidémica en los resultados hospitalarios.
El dato ÚTIL: cuándo y dónde hay que empezar a prestar más atención o incluso reforzar la atención
Private companies are deciding what the truth is,&it's fear
Here, in YouTube policies on Covid, demonetization threatens influencers, if they don't accomplish Covid Narrative
Curious distress from restrictions ISN'T acceptable, while hospital images provide 'context of a story'
This a famous Spanish youtuber, with a music channel, in a video on Chopin.
While he refers to tuberculosis he AVOIDS to even say Covid in a virus/bacteria comparison, and he adds 'i don't want to say it, or YouTube will demonetize this video'.
Threaten works.
I get to know thanks to this tweet, and I get shocked by how nude censorship was operating.
Imagine if you just can name Covid in a casual comparison about Chopin's death, how harsh the punishment could be if you dare to critic the lesser Covid narrative
Everytime u hear a VARIANT explanation, always scary, be sure u're considered dumb
Now, it is the India variant
The process is always the same, variant detection, increase in cases and horrible local images in media: now, same Indian CPResuscitation and funeral pyres everywhere
Media Fear Porn on Indian Variant began last March.
Guess what was growing then in India?
Bingo
Testing DOUBLED
They're recurring India now cos brute numbers are HUGE
"Pandemic in India" is ONE FIFTH of the whole world's epidemic.
When POP scaled nothing special going on there
South Africa Variant?
Let's check.
SA variant media fear campaign began December '20.
Again, testing rocketed x4.
In this crazy antiscientifical system that means for times more CASES too.
WORST NUMBER OF CASES IN A DAY IN ANY COUNTRY, decorated with terrible burning corpses images.
At the same time the Indian Double Variant appears as The New Threaten.
A little detail is left apart:
~1.4 BILLION inhabitants
If we scale to Population India's figures we notice it's quite NOTHING extraordinary going on there.
Both cases and deaths are in what we experienced as low range for this crisis.
Talking about Armageddon in India today with similar, even lower, figures is pure PROPAGANDA.
Guess what is really growing?
As usual, tests.
In the last ~2 months, test pressure was more than DOUBLED.
Cases (and detected deaths) grow at test rates.
The old very same Fear Trick
They sold 3K deaths in China like The End of the World.
Are we stupid enough to swallow again?
Every Friday, the Spain's daily report includes a test done/positivity graph.
It allows us to directly check test policy Vs perceived epidemic.
Apart from the yet officially unexplained partial relation between them (more test, more positivity), we can check trends.
While positivity follows a harmonic waving, we observe 2 prominent abrupt spikes in testing, unrelated to any trend change in positivity.
1st is JUST the week before Xmas, 2nd the week before Easter.
How appropriate.
Just preforming the Irresponsible behaviour during holidays.
Now we're under extra test pressure, the Easter Bump, the little valley is due to holiday testing cease, and inner political issue (Madrid elections) is to blame for the delayed decrease.
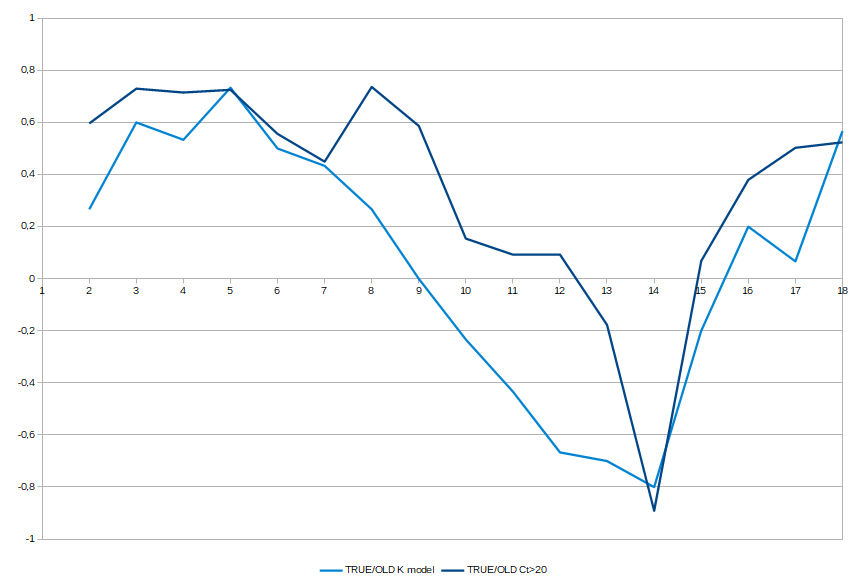
We've refined a little more our Old Fake estimate as function of Ct values.
Madrid dataset we use included 3 Ct frames, <20, 20-30 & >30.
Our equation changes slightly:
%Old positivity=(Ct-28)/3
It brings a good approximate to calculated Old Detection:
Method used for this refinement was considering all the Ct>20 as true positive and considering Average Ct for >20.
We observe the calculated Old Positivity fits with this average Ct, and we used to estimate the relation.
Our equation also models that every point the Ct Average grows, the Old Positivity increases ~30%, so around Ct~31 and over your detecting almost only Old Fake Positives.