Saw this story, and I swear to you I thought it was from ~2 months ago as I read:

"Covid-19 cases will likely surge again in the U.S. as the highly contagious B.1.1.7 variant takes hold across the country"

Nope. Dated today. Yowza.

Brief thread 🧵🧵🧵
cnbc.com/2021/05/05/cdc…
Here is the link to the CDC model the story references.
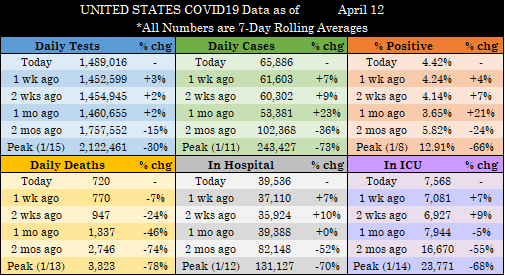
The model used "data available through March 27, 2021" to forecast cases, hospitalizations, and deaths varying vaccination (low/high) and NPI (low/moderate).
cdc.gov/mmwr/volumes/7…
B117 has comprised more than 50% of our cases for likely more than a month now. The CDC has it at ~60% as of 4/10. Here's the link:
covid.cdc.gov/covid-data-tra…
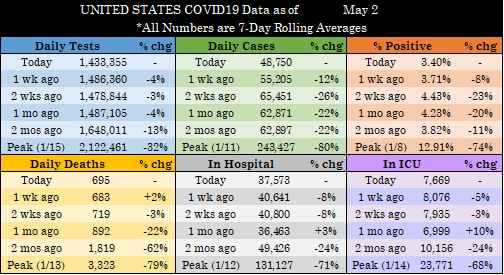
Per the state dashboard data that our team gathers and that I post nightly, 7-day-averaged cases peaked on 4/13. They've been dropping precipitously in the 3 weeks since. You have to go back to early October to get to our current case counts.
Not only that, but the positive testing percentage is at pandemic lows (7DA) damn near every day now, so it's likely that we're capturing more infections with our reported cases. Regardless, we're hitting new 2021 case lows daily.

(Another big week-over-week drop coming tonight)
We have California as a majority-B117 population than can barely muster 1% positive on a bad day. Come on, folks.
public.tableau.com/profile/helix6…
I'll end with the case graph from the CDC model at issue, with my additions in red based on the actual data. And they put this out today as if it's some real-time harbinger of doom?

Swing and a miss...

(Red dots might even extend a bit lower, but I wanted to be conservative)
Credit to @erikaedwardsnbc for her article on the CDC's release of the older model. Played it as a straight news piece but with much more appropriate framing, and showed some knowledge of the data. Even (correctly, imo) used "uptick" to describe rises we're seeing in the PNW.
Whoops, meant to link the article as well! I'll do one better. Here's her tweet with the article:

• • •

Missing some Tweet in this thread? You can try to force a refresh
 

Keep Current with Craig

Craig Profile picture

Stay in touch and get notified when new unrolls are available from this author!

Read all threads

This Thread may be Removed Anytime!

PDF

Twitter may remove this content at anytime! Save it as PDF for later use!

Try unrolling a thread yourself!

how to unroll video
  1. Follow @ThreadReaderApp to mention us!

  2. From a Twitter thread mention us with a keyword "unroll"
@threadreaderapp unroll

Practice here first or read more on our help page!

More from @TheLawyerCraig

5 May
#COVID19 UPDATE THREAD – MAY 4

All graphics are 7-day averages. Today’s raw reporting for each metric is in the tweet below.

(Data retrieved directly from state dashboards. Not every state updates its numbers daily.)

UNITED STATES
Today’s raw reported metrics:

- Tests: 1,001,602 (-108,738)

- Cases: 40,204 (-8,642)

- Deaths: 886 (+97)

- Currently Hospitalized: 35,661 (+247)

- Currently in ICU: 7,435 (+89)

(+/- compared to same day last week for Tests/Cases/Deaths & yesterday for Hosp/ICU)
Mostly “meh” day. Hospitalizations got the standard Tuesday bump, and a little more than last week. Reported deaths jumped, which brought us back to 700 on the 7-day average. But cases keep melting, and we again hit a new pandemic low positive testing percentage.
Read 17 tweets
4 May
#COVID19 UPDATE THREAD – MAY 3

All graphics are 7-day averages. Today’s raw reporting for each metric is in the tweet below.

(Data retrieved directly from state dashboards. Not every state updates its numbers daily.)

UNITED STATES
Today’s raw reported metrics:

- Tests: 1,211,012 (-206,007)

- Cases: 45,265 (-8,679)

- Deaths: 362 (-61)

- Currently Hospitalized: 35,414 (-184)

- Currently in ICU: 7,346 (-84)

(+/- compared to same day last week for Tests/Cases/Deaths & yesterday for Hosp/ICU)
Drops across all metrics, and we hit another new low positive testing percentage again today. Average daily cases have dropped week-over-week by double-digit percentages for the past 13 days straight. Hopefully that trend continues.
Read 18 tweets
3 May
#COVID19 UPDATE THREAD – MAY 2

All graphics are 7-day averages. Today’s raw reporting for each metric is in the tweet below.

(Data retrieved directly from state dashboards. Not every state updates its numbers daily.)

UNITED STATES Image
Today’s raw reported metrics:

- Tests: 1,114,963 (+11,769)

- Cases: 26,945 (-2,727)

- Deaths: 368 (+19)

- Currently Hospitalized: 35,598 (-901)

- Currently in ICU: 7,429 (-56)

(+/- compared to same day last week for Tests/Cases/Deaths & yesterday for Hosp/ICU)
California reported another large death number today. CA was +70 compared to last Sunday, while the rest of the nation -51. We’re just hanging out in the high 600s lately, and I’m ready for states to clear the old data and see that number start to fall.
Read 7 tweets
15 Apr
#COVID19 UPDATE THREAD – APRIL 14

All graphics are 7-day averages. Today’s raw reporting for each metric is in the tweet below.

(Data retrieved directly from state dashboards. Not every state updates its numbers daily.)

UNITED STATES
Today’s raw reported metrics:

- Tests: 1,428,603 (+67,842)

- Cases: 70,751 (-1,001)

- Deaths: 869 (-69)

- Currently Hospitalized: 41,185 (+33)

- Currently in ICU: 7,992 (+92)

(+/- compared to same day last week for Tests/Cases/Deaths & yesterday for Hosp/ICU)
Raw metric changes today were pretty flat. Decreases in reported cases/percent positive. Increases in reported deaths and hospitalizations/ICUs. One nice piece of news: Michigan’s hospitalizations dropped today for the first daily decrease since 3/10.
Read 6 tweets
13 Apr
#COVID19 UPDATE THREAD – APRIL 13

All graphics are 7-day averages. Today’s raw reporting for each metric is in the tweet below.

(Data retrieved directly from state dashboards. Not every state updates its numbers daily.)

UNITED STATES Image
Today’s raw reported metrics:

- Tests: 1,330,264 (+22,755)

- Cases: 76,267 (+16,481)

- Deaths: 804 (-24)

- Currently Hospitalized: 41,152 (+1,054)

- Currently in ICU: 7,899 (+204)

(+/- compared to same day last week for Tests/Cases/Deaths & yesterday for Hosp/ICU)
Some big plus signs up there (and one important minus sign). Received a few non-pipeline dumps in cases today, but I’m not pulling them out of the numbers. Most are just the slinky effect in action (AL dumped from as far back as Oct, but only 1150 total cases).
Read 18 tweets
12 Apr
#COVID19 UPDATE THREAD – APRIL 12

All graphics are 7-day averages. Today’s raw reporting for each metric is in the tweet below.

(Data retrieved directly from state dashboards. Not every state updates its numbers daily.)

UNITED STATES Image
Today’s raw reported metrics:

- Tests: 1,310,181 (-120,202)

- Cases: 62,454 (-6,110)

- Deaths: 397 (+17)

- Currently Hospitalized: 40,098 (+905)

- Currently in ICU: 7,698 (+140)

(+/- compared to same day last week for Tests/Cases/Deaths & yesterday for Hosp/ICU)
I am still laughing my ass off at the Deadliest Catch + NASCAR + CMT thing. Her sincerity is what got me the most. I thought it was kind of endearing—had to check the notes for a bit to be like, “Are these the right names for these things?”
Read 19 tweets

Did Thread Reader help you today?

Support us! We are indie developers!


This site is made by just two indie developers on a laptop doing marketing, support and development! Read more about the story.

Become a Premium Member ($3/month or $30/year) and get exclusive features!

Become Premium

Too expensive? Make a small donation by buying us coffee ($5) or help with server cost ($10)

Donate via Paypal Become our Patreon

Thank you for your support!

Follow Us on Twitter!

:(