#COVID19 UPDATE THREAD – APRIL 12
All graphics are 7-day averages. Today’s raw reporting for each metric is in the tweet below.
(Data retrieved directly from state dashboards. Not every state updates its numbers daily.)
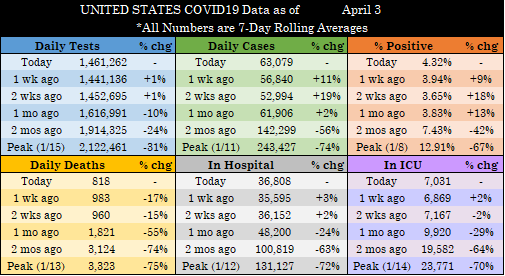
UNITED STATES
All graphics are 7-day averages. Today’s raw reporting for each metric is in the tweet below.
(Data retrieved directly from state dashboards. Not every state updates its numbers daily.)
UNITED STATES
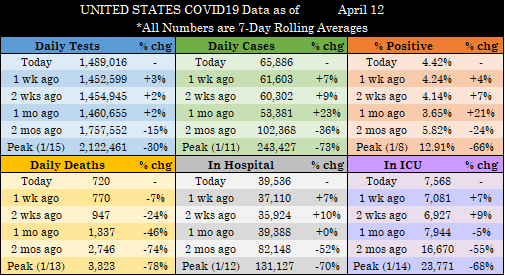
Today’s raw reported metrics:
- Tests: 1,310,181 (-120,202)
- Cases: 62,454 (-6,110)
- Deaths: 397 (+17)
- Currently Hospitalized: 40,098 (+905)
- Currently in ICU: 7,698 (+140)
(+/- compared to same day last week for Tests/Cases/Deaths & yesterday for Hosp/ICU)
- Tests: 1,310,181 (-120,202)
- Cases: 62,454 (-6,110)
- Deaths: 397 (+17)
- Currently Hospitalized: 40,098 (+905)
- Currently in ICU: 7,698 (+140)
(+/- compared to same day last week for Tests/Cases/Deaths & yesterday for Hosp/ICU)
I am still laughing my ass off at the Deadliest Catch + NASCAR + CMT thing. Her sincerity is what got me the most. I thought it was kind of endearing—had to check the notes for a bit to be like, “Are these the right names for these things?”
I expected to see a large drop in cases today as compared to last Monday. It’s essentially the opposite of yesterday’s increase. Because several states doubled up last Monday, it was nearly certain we’d drop by thousands over last week.
Very small increase in reported deaths compared to last Monday (which was reporting Easter’s numbers), so I’m still happy with our number today. We’ll be coming down off our 7-day-averaged artificial high for the next couple days (and should clear fully by Friday).
Glimmer of hope in MI? We’re 3 days beyond 7-day-averaged peaks for cases & % positive. Hospitalizations jumped 343 coming off the non-reporting weekend today, but that number was 753 the first day following last weekend (though it was a 3-day weekend then).
Vaccine update—another record today! Also, I just noticed that @CohoKelly is a single follower shy of 4K. His data presentation is simple and clean. You should give him a follow.
https://twitter.com/CohoKelly/status/1381670396425084941?s=20
I’ll get the regionals up shortly tonight. Give me a little bit.
MICHIGAN

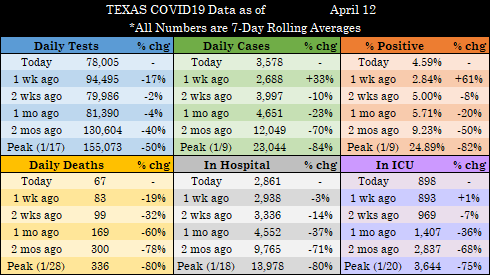
TEXAS
CALIFORNIA

FLORIDA

SOUTHEAST
(AL, AR, GA, KY, LA, MS, NC, SC, TN)
(AL, AR, GA, KY, LA, MS, NC, SC, TN)

SOUTHWEST
(AZ, NM, NV, OK, UT)
(AZ, NM, NV, OK, UT)

PACIFIC NORTHWEST/ROCKIES
(CO, ID, MT, OR, WA, WY)
(CO, ID, MT, OR, WA, WY)

GREAT PLAINS
(IA, KS, MN, MO, ND, NE, SD)
(IA, KS, MN, MO, ND, NE, SD)

GREAT LAKES
(IL, IN, OH, WI)
*Removed MI from trend data, but peaks still include MI data
(IL, IN, OH, WI)
*Removed MI from trend data, but peaks still include MI data

MID-ATLANTIC
(DC, DE, MD, PA, VA, WV)
(DC, DE, MD, PA, VA, WV)

NORTHEAST
(CT, MA, ME, NH, NJ, NY, RI, VT)
(CT, MA, ME, NH, NJ, NY, RI, VT)

• • •
Missing some Tweet in this thread? You can try to
force a refresh