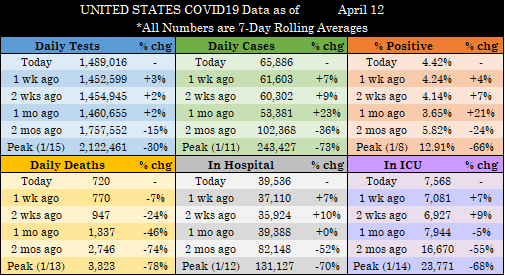
All graphics are 7-day averages. Today’s raw reporting for each metric is in the tweet below.
(Data retrieved directly from state dashboards. Not every state updates its numbers daily.)
UNITED STATES
Today’s raw reported metrics:
- Tests: 1,330,264 (+22,755)
- Cases: 76,267 (+16,481)
- Deaths: 804 (-24)
- Currently Hospitalized: 41,152 (+1,054)
- Currently in ICU: 7,899 (+204)
(+/- compared to same day last week for Tests/Cases/Deaths & yesterday for Hosp/ICU)
Some big plus signs up there (and one important minus sign). Received a few non-pipeline dumps in cases today, but I’m not pulling them out of the numbers. Most are just the slinky effect in action (AL dumped from as far back as Oct, but only 1150 total cases).
We’re now at our highest 7-day average for both cases and % positive since 2/18, but at our lowest number for deaths since 10/19.
MI was another state that seemed to inject a pretty hefty backlog of some sort, but for both cases and tests. So the percent testing positive actually dropped to the point where it’s about flat week-over-week now.
Vaccine update. Yet another new peak for the 7-day average.
We’re starting to see some rise now in regions that were flat or down recently, but let’s see what the rest of the week brings. I’ll get the regionals up here in a few…
All graphics are 7-day averages. Today’s raw reporting for each metric is in the tweet below.
(Data retrieved directly from state dashboards. Not every state updates its numbers daily.)
UNITED STATES
Today’s raw reported metrics:
- Tests: 1,428,603 (+67,842)
- Cases: 70,751 (-1,001)
- Deaths: 869 (-69)
- Currently Hospitalized: 41,185 (+33)
- Currently in ICU: 7,992 (+92)
(+/- compared to same day last week for Tests/Cases/Deaths & yesterday for Hosp/ICU)
Raw metric changes today were pretty flat. Decreases in reported cases/percent positive. Increases in reported deaths and hospitalizations/ICUs. One nice piece of news: Michigan’s hospitalizations dropped today for the first daily decrease since 3/10.
All graphics are 7-day averages. Today’s raw reporting for each metric is in the tweet below.
(Data retrieved directly from state dashboards. Not every state updates its numbers daily.)
UNITED STATES
Today’s raw reported metrics:
- Tests: 1,310,181 (-120,202)
- Cases: 62,454 (-6,110)
- Deaths: 397 (+17)
- Currently Hospitalized: 40,098 (+905)
- Currently in ICU: 7,698 (+140)
(+/- compared to same day last week for Tests/Cases/Deaths & yesterday for Hosp/ICU)
I am still laughing my ass off at the Deadliest Catch + NASCAR + CMT thing. Her sincerity is what got me the most. I thought it was kind of endearing—had to check the notes for a bit to be like, “Are these the right names for these things?”
It's interesting to compare states with a high percentage of the B.1.1.7 variant of #Covid19, but which are located in different regions of the US.
There are 5 states that have shown >50% #B117 for more than 2 weeks now, and their trends are quite different.
Thread 🧵
The first 5 states that have hit >50% of #B117 are Florida, Georgia, Michigan, Minnesota, and Texas. This is according to the @my_helix 5-day moving average
(Link: public.tableau.com/profile/helix6…)
I first started looking at this site after reading @DrEricDing's thread tracking the #B117 percentages—specifically noting Florida, Georgia, and Michigan as growing threats. This was a little over two weeks ago, here:
All graphics are 7-day averages. Today’s raw reporting for each metric is in the tweet below.
(Data retrieved directly from state dashboards. Not every state updates its numbers daily.)
UNITED STATES
Today’s raw reported metrics:
- Tests: 1,620,530 (+90,643)
- Cases: 66,023 (+9,090)
- Deaths: 758 (-57)
- Currently Hospitalized: 36,913 (-398)
- Currently in ICU: 7,003 (-47)
(+/- compared to same day last week for Tests/Cases/Deaths & yesterday for Hosp/ICU)
As I said last night, we’re looking at volatility for a little while (see quoted thread). And this isn’t just a holiday thing, but a Sat-Mon thing going forward. States’ weekend reporting has become spotty and inconsistent.
All graphics are 7-day averages. Today’s raw reporting for each metric is in the tweet below.
(Data retrieved directly from state dashboards. Not every state updates its numbers daily.)
UNITED STATES
Today’s raw reported metrics:
- Tests: 1,683,615 (-271,539)
- Cases: 65,599 (-7,631)
- Deaths: 944 (-461)
- Currently Hospitalized: 37,311 (+108)
- Currently in ICU: 7,050 (-29)
(+/- compared to same day last week for Tests/Cases/Deaths & yesterday for Hosp/ICU)
Before popping the cork at seeing those large minus signs in key metrics, please read my thread from earlier today (quoted). As if on cue, a few states that normally report on Fridays didn’t report at all. Others likely reported less-than-complete data.
For those who follow my daily #Covid19 data updates, it's time for another period of likely volatility based on holiday reporting. Based on past holidays, here's what should happen:
(Thread)
Starting as early as today, reported numbers for tests, cases, and deaths will likely be lower than they would otherwise have been without a holiday.
This does *not* necessarily mean that (1) they will drop, or (2) every state/region will see the same amount of volatility.
This artificial deflation will likely continue through ~Tuesday of next week.
Then, the opposite happens! For 3-4 days, states generally report their current "pipeline" numbers PLUS any backlog numbers. We should see that from ~Wed-Sat of next week.