Ontario update.
#covid19ontario #COVID19 #covid19Canada
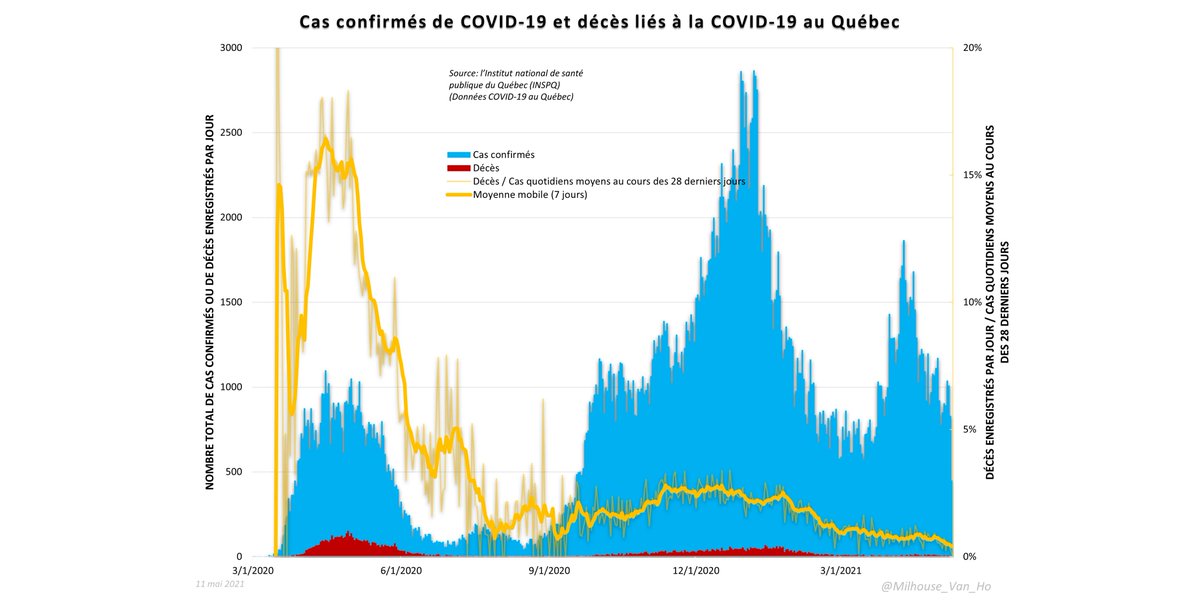
Ontario covid-19 cases, deaths, and testing.
#covid19ontario #COVID19 #covid19Canada
Ontario covid-19 cases, deaths, and testing.

Ontario - The proportion of cases (positive test results) resulting in death (yellow line). (Daily reported deaths divided by average daily cases over prior 28 days.)

Weekly all-cause deaths and deaths with/from Covid-19 in Ontario, including % of deaths attributed to Covid-19. (Subject to reporting delay for all-cause deaths.)

Note: Covid-19 is often not a wholly distinct and separate cause of death as there are other medical conditions involved in many cases.
There are also cases in which it is not even a cause of death, but the individual had tested positive sometime prior to their death.
There are also cases in which it is not even a cause of death, but the individual had tested positive sometime prior to their death.

Ontario total weekly deaths Jan 2010-Jan 2021.

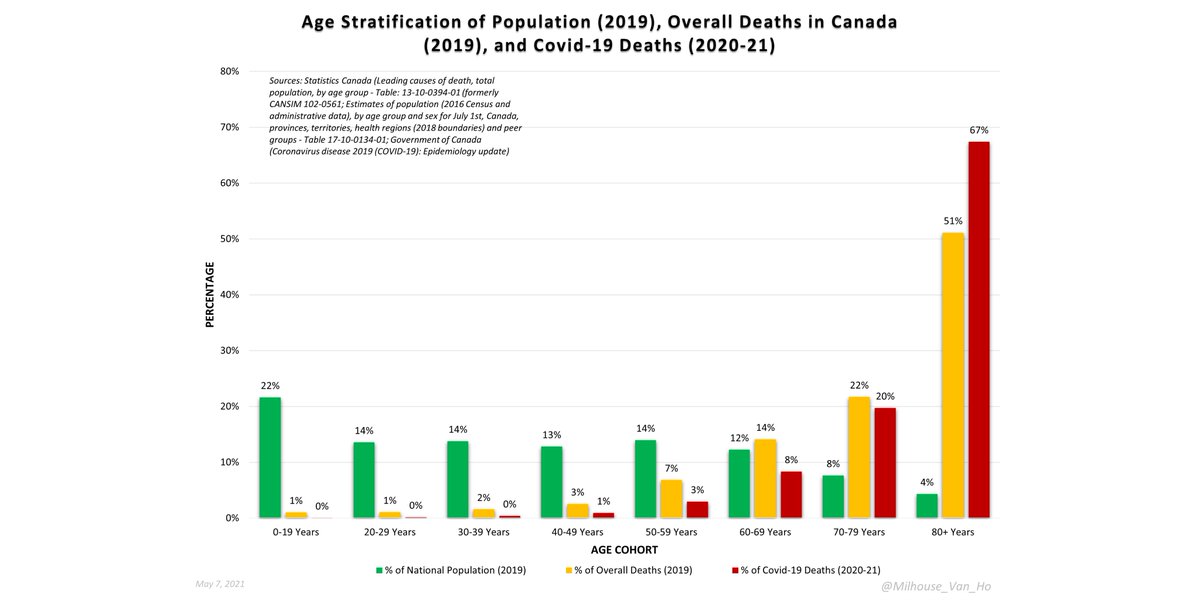
Covid-19 deaths per million by age cohort and for long-term care residents.

The 70+ age cohort accounts for 12% of the population of Ontario but 84% of deaths from or with Covid-19 and 73% of all-cause deaths.

The silver lining of mass PCR testing: a falling CFR.
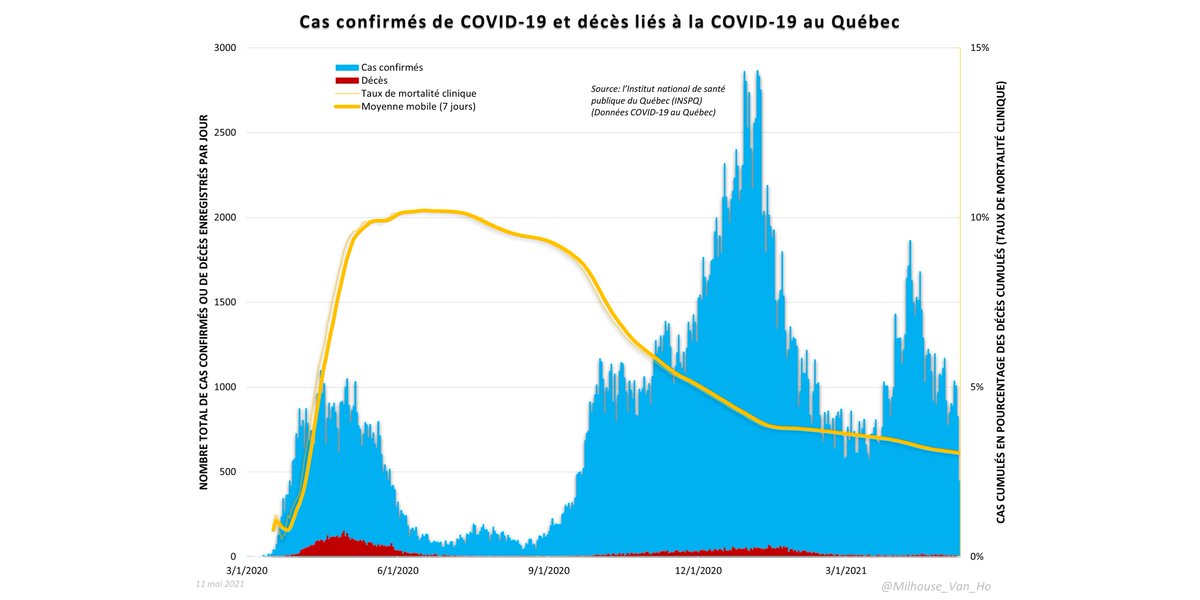
Ontario – Cumulative case fatality rate (CFR). The proportion of cases (positive test results) resulting in death (yellow line). (Cumulative reported deaths divided by cumulative cases.)
Ontario – Cumulative case fatality rate (CFR). The proportion of cases (positive test results) resulting in death (yellow line). (Cumulative reported deaths divided by cumulative cases.)

Ontario – Case survival rates (= 100% - case fatality rate) by age.
(True survival rates based on IFR would be significantly higher.)
(True survival rates based on IFR would be significantly higher.)

Daily new hospitalizations and cumulative case hospitalization rate (cumulative reported hospitalizations divided by cumulative cases.)

Ontario covid-19 cases, hospitalizations, deaths, and testing.

The number of hospitalizations linked to covid-19 in Ontario relative to historical benchmark levels for influenza and pneumonia.

A note on hospitalization data: This may include those who have had a positive test result after being hospitalized for a different reason.

Ontario Fall/Winter season.

Sources:
data.ontario.ca/dataset/status…
publichealthontario.ca/en/data-and-an…
news.ontario.ca/en/release/566…
covid-19.ontario.ca/covid-19-epide…
covid-19.ontario.ca/data
www150.statcan.gc.ca/t1/tbl1/en/cv.…
www150.statcan.gc.ca/t1/tbl1/en/cv.…
www150.statcan.gc.ca/t1/tbl1/en/tv.…
data.ontario.ca/dataset/status…
publichealthontario.ca/en/data-and-an…
news.ontario.ca/en/release/566…
covid-19.ontario.ca/covid-19-epide…
covid-19.ontario.ca/data
www150.statcan.gc.ca/t1/tbl1/en/cv.…
www150.statcan.gc.ca/t1/tbl1/en/cv.…
www150.statcan.gc.ca/t1/tbl1/en/tv.…
• • •
Missing some Tweet in this thread? You can try to
force a refresh