A quick overview thread of case rates prior to moving to Step 3 on 17 May.
Overall cases in the UK are at 21 cases per 100,000.
Overall cases in the UK are at 21 cases per 100,000.

Case rates are higher than they were last summer after the first wave and before that unlocking.
Some of this is increase is due to mass testing.
In late June last year, cases in all age groups were under 10 cases per 100,000 (except 80+ where they were 12 per 100,000).
Some of this is increase is due to mass testing.
In late June last year, cases in all age groups were under 10 cases per 100,000 (except 80+ where they were 12 per 100,000).

Cases now are higher.
If we compare to the extreme situation in January (seen below), things don't look too bad. If we compare to June last year, cases do look relatively high.
If we compare to the extreme situation in January (seen below), things don't look too bad. If we compare to June last year, cases do look relatively high.

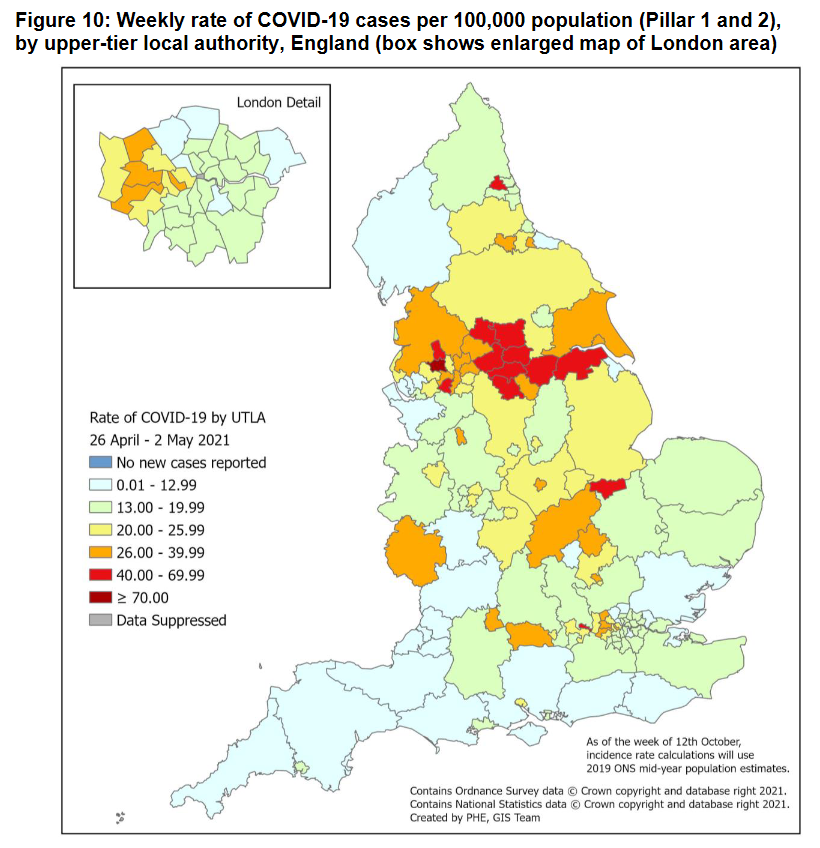
As you zoom in to areas, the highest case rates increase. This is to be expected, as nowhere is 'average'.
From Bolton with a very high 133 cases per 100,000 to low rates in some parts of Scotland, Wales, and Northern Ireland.
In England, Cumbria has a case rate of 5 per100,000
From Bolton with a very high 133 cases per 100,000 to low rates in some parts of Scotland, Wales, and Northern Ireland.
In England, Cumbria has a case rate of 5 per100,000
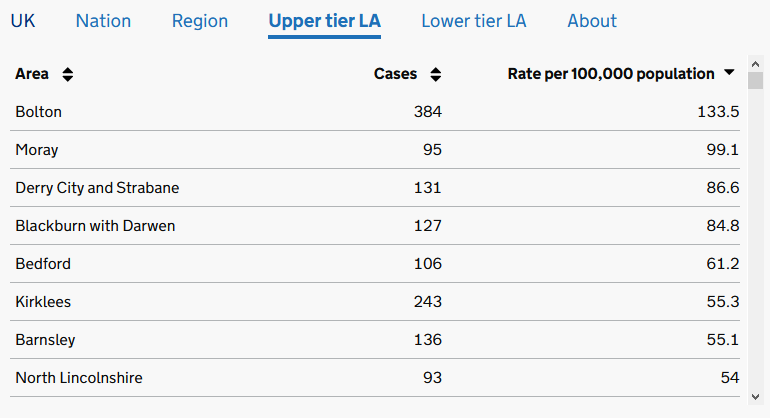

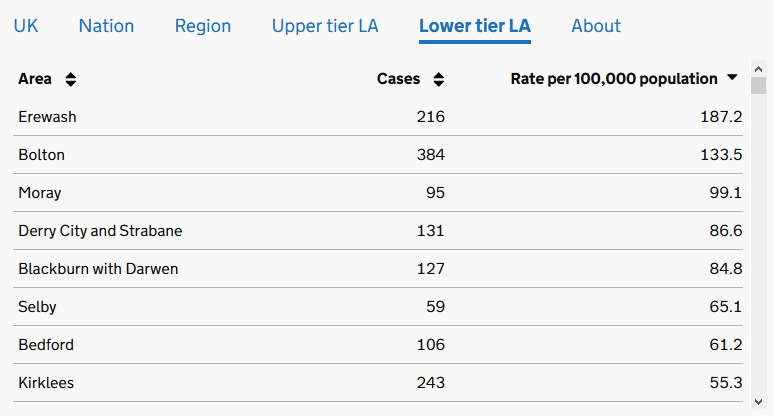
Zooming in further (note that some upper tier local authories are also lower tier local authorities, which confuses things a bit) we have some local authorities with *very high* rates
Erewash with 187 cases per 100,000
Bolton with 133 cases per 100,000
Erewash with 187 cases per 100,000
Bolton with 133 cases per 100,000
Rates over 100 cases per 100,000 were sufficient to cause local lockdowns. Some history:
https://twitter.com/Dr_D_Robertson/status/1321518534724358147
In particular areas, there are outbreaks.
Rumworth South has a case rate of 479 per 100,000
Rumworth South has a case rate of 479 per 100,000

Long Eaton North has a case rate of 645 per 100,000

Due to the vaccine programme, we are in a different time to last summer when no-one was vaccinated.
But there are significant dispartities in who is vaccinated.
But there are significant dispartities in who is vaccinated.
https://twitter.com/Dr_D_Robertson/status/1391775128258813955
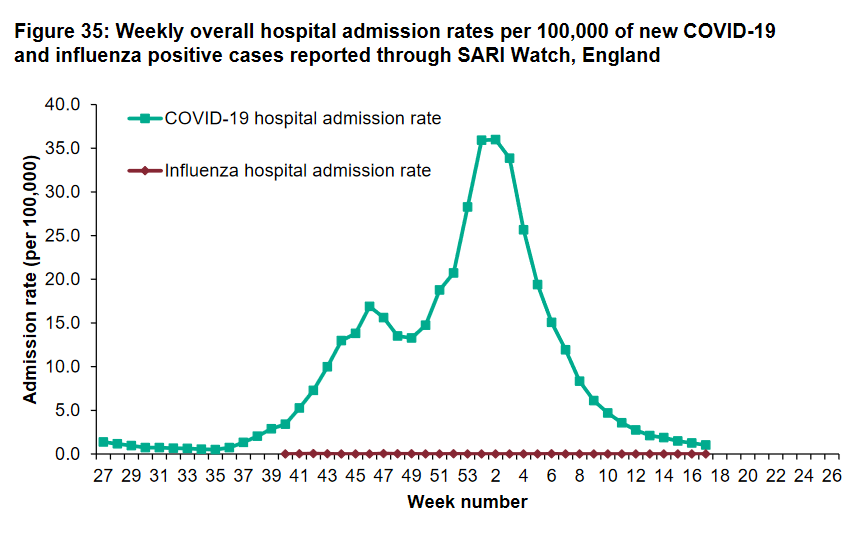
Much of the Government's strategy is based on the weakening of the link between cases to hospitalizations to deaths.
https://twitter.com/Dr_D_Robertson/status/1363881367197671425
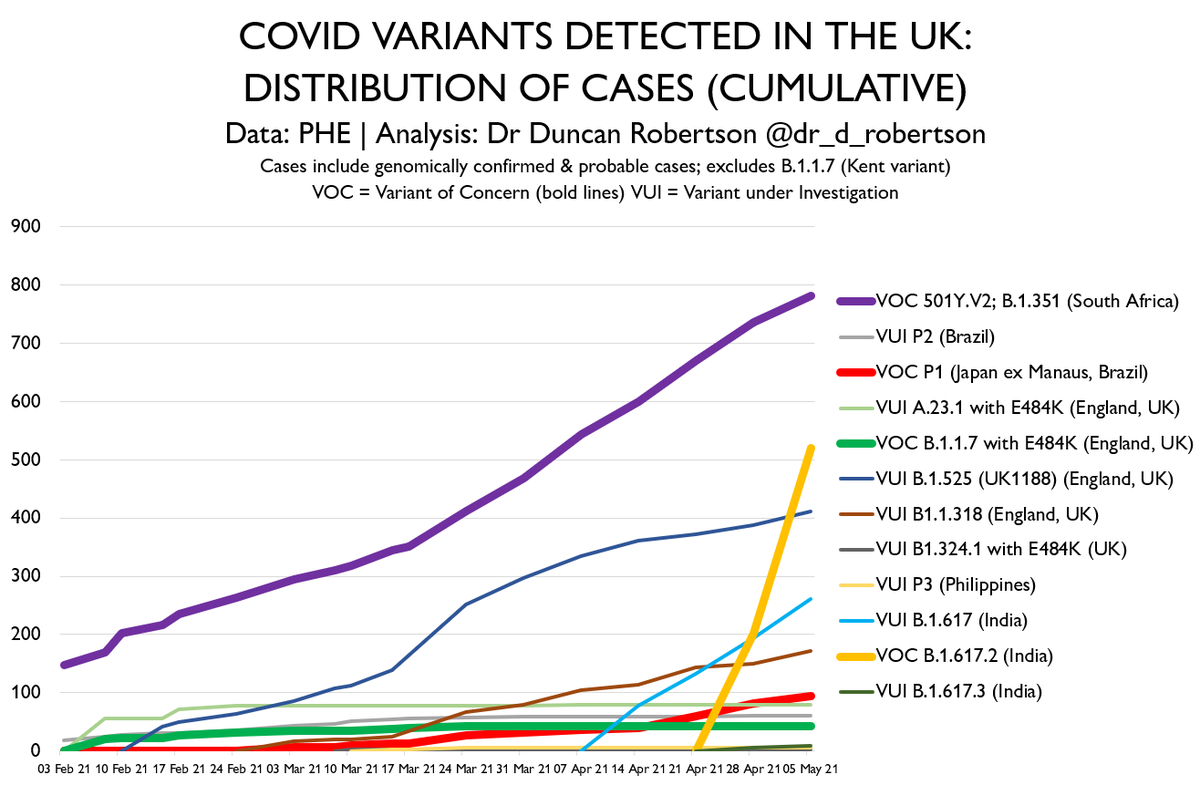
One of those Roadmap tests is Variants.
https://twitter.com/Dr_D_Robertson/status/1390648941922893828
The question is - what is the Government's plan if and when we have large outbreaks meaning that case rates are very high? Are regional lockdowns going to re-emerge? There appears to be scope for that in the legislation.
https://twitter.com/Dr_D_Robertson/status/1374004374347857926

If the whole of the UK moves to being in a Step 3 area as expected on 17 May, it presumbaly means that the Governement reserves the right to moves areas back to Step 2 or even Step 1 areas by statutory instrument.
The Government hopes that the moves are 'irreversible'. I assume the 'irreversible' applies to the whole of the country, not individual areas. It would be prudent to retain the option of reimposing these measures, even if the headline is that they are 'irreversible'.
Nobody wants to go back into restrictions, but there is a risk of that happening due to variants. This is however a *risk* not a certainty.
But if the rhetoric is Covid is almost over, then that risk becomes more likely to be realised.
The pandemic is not over.
But if the rhetoric is Covid is almost over, then that risk becomes more likely to be realised.
The pandemic is not over.
• • •
Missing some Tweet in this thread? You can try to
force a refresh