The latest #infectionsurvey from @ONS shows signs of an increase in England, from 0.07% to 0.09% (or 1 in 1,110), though the CI is from 0.07% to 0.11%, so it's too early to be sure.

Wales stays the lowest at 0.02% for the second week - that's 1 in 4,340.

1/
N Ireland falls from 0.07% to 0.06% (1 in 1,550), and this week Scotland shows the biggest fall, from 0.08% to 0.05% (1 in 1,960).

Note in the chart how wide the CI's are for all but England, so any one week needs to be considered with those in mind.

2/
Possibly surprisingly, given the focus on B.1.617.2 and the NW, that's not the area that is showing signs of increase. Instead ONS notes Yorks/Humber, the North East and South East as the areas where it judges prevalence to be increasing.

3/
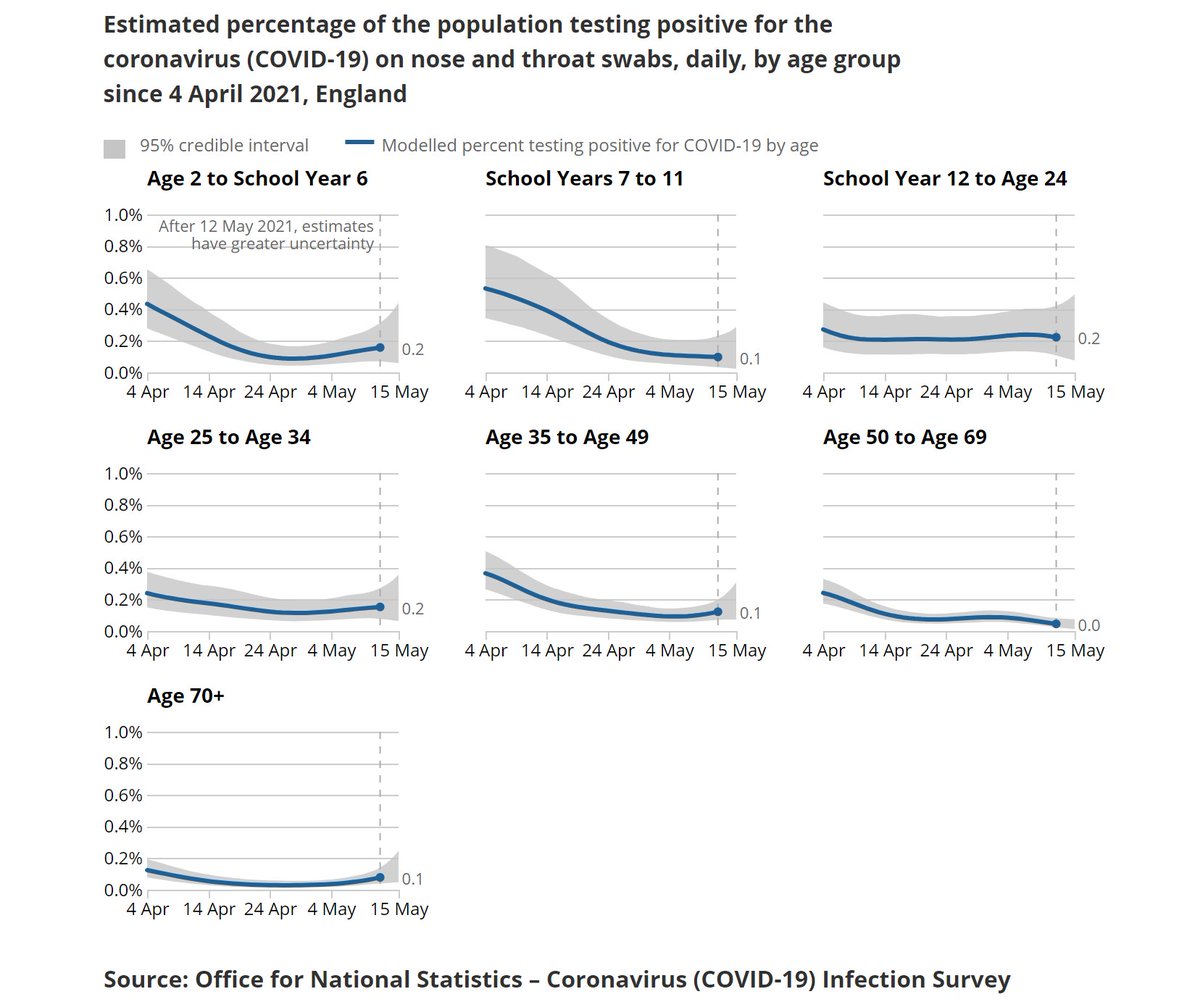
By age, the overall increase appears to be driven by primary school children, age 35 to 49, and, disappointingly given vaccine coverage, the over 70s, although this latter group remains at relatively low levels.

4/
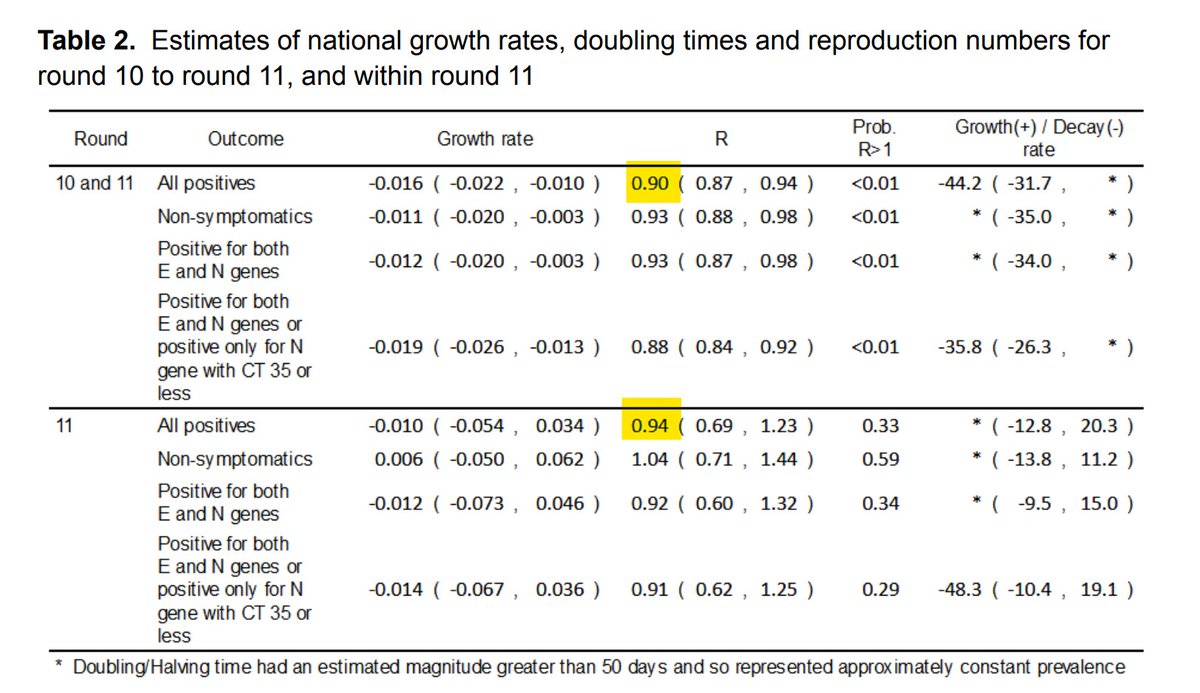
Regarding variants, ONS notes that it saw an increase in the prop'n compatible with B.1.1.7 in England, but the trend is uncertain. Given B.1.617.2 is not compatible with the Kent variant, that's also possibly a surprise, given other data showing a large increase in 617.2.

5/
However, there were only 111 positive cases in the last 2w in England, so a much smaller sample than the 9,000 new cases sequenced and reported yesterday. So it would appear that this aspect of the survey is unlikely to add to our knowledge of the current trend in variants.
6/
Survey here:

ons.gov.uk/peoplepopulati…

7/7

• • •

Missing some Tweet in this thread? You can try to force a refresh
 

Keep Current with John Roberts

John Roberts Profile picture

Stay in touch and get notified when new unrolls are available from this author!

Read all threads

This Thread may be Removed Anytime!

PDF

Twitter may remove this content at anytime! Save it as PDF for later use!

Try unrolling a thread yourself!

how to unroll video
  1. Follow @ThreadReaderApp to mention us!

  2. From a Twitter thread mention us with a keyword "unroll"
@threadreaderapp unroll

Practice here first or read more on our help page!

More from @john_actuary

20 May
England weekly take-up data from the NHS shows good take-up extending down into the 40-49 age band. It's pushed above 80% in the upper half, and looks as though it's likely to get to around that level for 40-44 as well.

Let's hope the thirties are as enthusiastic.

1/
Second doses have been concentrated on the sixties group in the last week, although there's been some progress in the fifties too. This data is up to last Sunday, so there won't be any impact from the acceleration announced last Friday.

2/
2nd dose take-up continues to look excellent, at over 96% above age 70, and with the upper 60's looking like it should surpass 90% in due course.

It's important to get the 2nd dose to get the fullest protection possible. One dose "only" prevents around 85% of serious illness.
3/
Read 4 tweets
19 May
Wed vaccine update (& Wales progress)

498k total reported today, just 3% up on last week.

1st doses resume their gradual upward progress, with 174k up 29%. We're now just shy of 37m, so around 10m to go, the exact figure depending on take-up in the younger age groups.

1/ Image
2nd doses were a disappointing 7% down at 324k, so little sign yet of the surge we might have expected with the announcement of bringing forward appointments for the under 50s to 8 weeks.

2/ Image
Over the border, we can see good progress through the younger age groups, with over half the thirties done, and nearly 75% of the forties. There's a definite gradient emerging as we move down below 50, but 75% is still a very respectable figure.

3/ Image
Read 5 tweets
19 May
A new paper today published by @Anaes_Journal by @doctimcook and others shows the impact of the second wave on surgery levels. A short thread to summarise the results.

1/
Three surveys were done, corresponding to the greyed areas below, the final one coming at the peak in January. It's thought that those responding (c50% -60%) may reflect those hospitals which coped better, so the results could understate the extent of the impact.

2/ Image
Unavailability of staff was a key issue. You can see below that the predominant reason for this was that staff were redeployed into ICU's rather than absent for other reasons. The expansion of ICU's to cope with COVID patients will have been the cause of this.

3/ Image
Read 7 tweets
13 May
I nearly missed today's 2 weekly antibody update from @ONS, so here's a brief summary. It's fairly disappointing though, with no material increases, and the modelled curves dipping.

E increases from 68.3% to 69.3% (65.6%, 73.9%)
W is up from 61.0% to 63.2% (58.8%, 68.3%)

1/
S is up from 57.8% to 59.2% (54.8%, 64.4%)
NI is up from 62.5% to 63.5% (57.6%, 71.2%)

Of note the modelled curve for NI is increasing, although the increase from the last update is no greater than the others.

2/
It's interesting that even the unvaccinated age groups are showing nearly 50% prevalence. Further up, the highest age groups are now rising again, as the 2nd dose takes effect, but lower down we're now seeing the dip that we saw earlier in the highest groups.

3/
Read 4 tweets
13 May
Thu vaccine update (incl England weekly data)

637k total doses today, 17% up on last week, bringing the 7D total back to 3.6m, close to the late April high.

1st doses of 184k are up 32%, and are the highest daily total since March, bringing the 7D total close to 1m.

1/5
A good day all round with 2nd doses of 452k up 12%, bringing the 7D total back up to 2.6m, and the overall total to just shy of 19m.

2/5
On take-up, England 1st doses have made more progress in the 45-49 group and look as though they should just hit 80% in due course.

That would be 10% less than the band above, which is a little worrying in terms of a downward trend as we work down the ages.

3/5
Read 5 tweets
13 May
A summary thread of the latest #REACT survey from @imperialcollege on England infectivity.

The headline is very good news, prevalence has halved since the last round, falling from 0.20% to 0.10%, with R at 0.9 between the rounds.

Round 11 is between April 15 and May 3.

1/
115 positive samples were obtained from 127k tests. Note the slightly lower number of tests this round, which the report notes is due to a lower response rate, suggesting a lower interest in participants as the situation improves.

2/
Between rounds, R is put at 0.9, though slightly higher at 0.94 within the round. This is consistent with recent SAGE views, and not unexpected as the lockdown restrictions are gradually eased.

3/
Read 11 tweets

Did Thread Reader help you today?

Support us! We are indie developers!


This site is made by just two indie developers on a laptop doing marketing, support and development! Read more about the story.

Become a Premium Member ($3/month or $30/year) and get exclusive features!

Become Premium

Too expensive? Make a small donation by buying us coffee ($5) or help with server cost ($10)

Donate via Paypal Become our Patreon

Thank you for your support!

Follow Us on Twitter!

:(