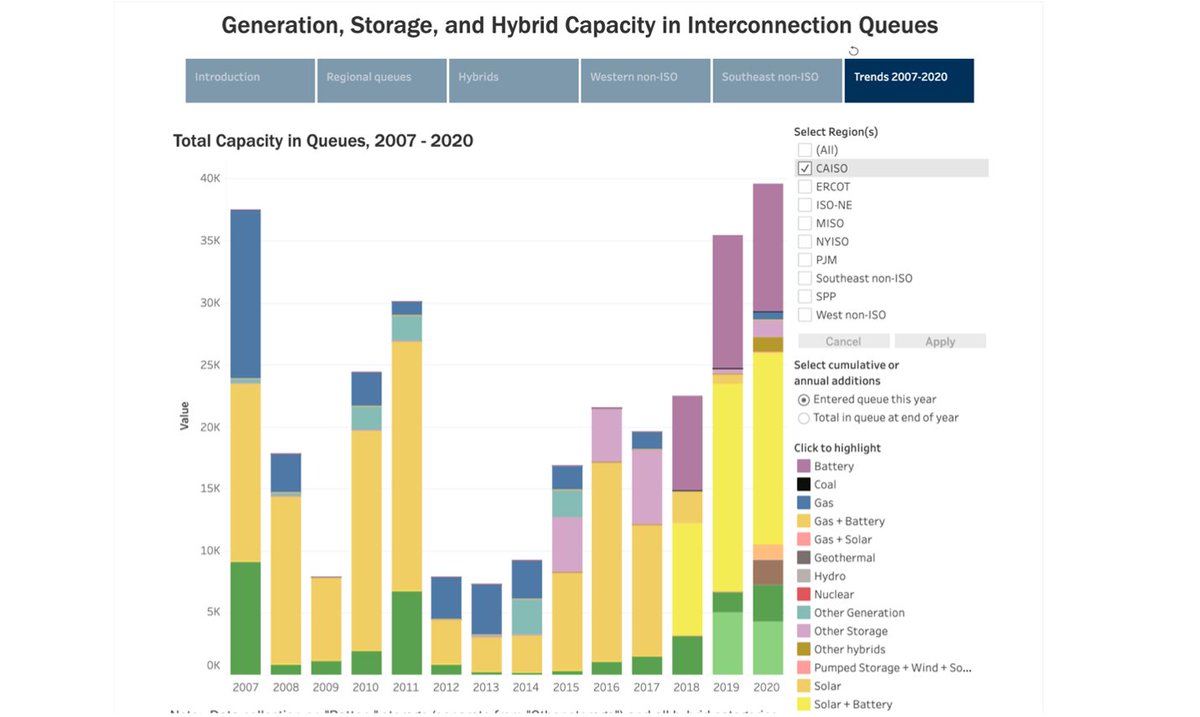
We have new data on utility interconnection queues! THREAD! There is now over 750 GW of generation and 200 GW of storage capacity in interconnection queues in the US – a new record. For full data and more, see QUEUED UP at emp.lbl.gov/publications/q…. 1/x
To put that in perspective, the US had a total of 1,117 GW of utility-scale capacity operating last year. While not all projects will get built, it shows strong commercial interest in new development. See the interactive data visualization at emp.lbl.gov/publications/q… 2/x
Solar and wind dominate the queues. Solar is booming, and increasingly paired with storage. Wind queues are consistent around 200 GW, while gas projects in queues have declined. Including estimated battery capacity for some hybrid projects, proposed storage exceeds 200 GW. 3/x
Over half of proposed capacity is for solar or solar+storage projects. PJM and MISO saw the most newly proposed solar in 2020 while queues in California and the West are dominated by hybrid solar+storage and standalone batteries. 4/x
Wind is still booming in most regions. Now offshore wind projects account for 29% of wind capacity in queues, with 61 GW of projects proposed, mostly along the East Coast.

For full data and more, see emp.lbl.gov/publications/q…. 5/x
Unlike solar and storage, proposed natural gas power capacity has declined in most regions. The Southeast region is a notable exception – where nearly 40 GW of gas capacity is in development. For full data and more, see emp.lbl.gov/publications/q…. 6/x
Hybrid gen + storage projects are getting more common. Over 1/3 of proposed solar capacity is paired with batteries, and over half of proposed battery capacity is paired with generation. This is most true in the West, where hybrid projects outweigh solar-only by 3 to 1. 7/x
The hybrid trend is accelerating in the West. @California_ISO saw over 15 GW of solar + storage hybrids enter the queue in 2020, compared to only 5 MW of standalone solar, and 10 GW of standalone batteries. See our interactive data viz at emp.lbl.gov/generation-sto… 8/x
But how many will get built? We looked back at five RTOs and found only 24% of queued projects in 2000-2015 were built. Completion rates have declined since and are lower for wind and solar. Wait times are on the rise, from ~1.9 years in the 2000s to ~3.5 years in the 2010s. 9/x
For the full details on QUEUED UP, our data roundup of power generation capacity in grid interconnection queues, see a slide deck, data sets and interactive data tool at emp.lbl.gov/publications/q… /end

• • •

Missing some Tweet in this thread? You can try to force a refresh
 

Keep Current with EMP at Berkeley Lab

EMP at Berkeley Lab Profile picture

Stay in touch and get notified when new unrolls are available from this author!

Read all threads

This Thread may be Removed Anytime!

PDF

Twitter may remove this content at anytime! Save it as PDF for later use!

Try unrolling a thread yourself!

how to unroll video
  1. Follow @ThreadReaderApp to mention us!

  2. From a Twitter thread mention us with a keyword "unroll"
@threadreaderapp unroll

Practice here first or read more on our help page!

More from @BerkeleyLabEMP

13 Apr
THREAD: In 2005, the official Annual Energy Outlook saw power sector CO2 rising from 2,400 to 3,000 MMT by 2020. But actual emissions fell to 1,450 MMT, 52% below projected levels. A new @BerkeleyLab report looks at how we got “halfway to zero.” emp.lbl.gov/publications/h… 1/11
The biggest change was drastically less demand for electricity, due in part to sectoral and economic changes, but also to greater energy efficiency driven by policies and technology advancement. Instead of rising by 24% it was dead flat. 2/11
And as demand stayed flat, cheaper natural gas from the shale gas revolution combined with the rapid growth of wind and solar power to squeeze out coal. Some nuclear retirements were offset by greater output at existing plants. 3/11
Read 11 tweets
10 Nov 20
The new @BerkeleyLab compilation of utility-scale #solar data and trends is out! A briefing slide deck, data file, maps, and data visualizations can all be found at utilityscalesolar.lbl.gov.

Here are some highlights → THREAD
More than 4.5 GW of utility-scale (>5 MW) solar came online in 2019, bringing cumulative capacity to 29 GW. Projects are spread across all 10 regions that we track, though more heavily concentrated in the sunniest regions. Maps and data available at utilityscalesolar.lbl.gov. 2/x
The median installed cost of new projects in 2019 fell to $1.4/W-AC, down 20% from 2018 and more than 70% from 2010. 77% of projects and 88% of capacity added in 2019 used single-axis tracking. More details in the new @BerkeleyLab data resource at utilityscalesolar.lbl.gov. 3/x
Read 10 tweets
9 Nov 20
THREAD: New research from @BerkeleyLab, published in @NatureEnergyJnl, shows that policy and business model interventions can help low- and moderate-income households enjoy the benefits of rooftop #solar. Online at rdcu.be/b993z 1/x
Many states have programs to help low-income households go solar. But which create the biggest effects? Our research compares LMI incentives, leasing, and PACE finance programs. emp.lbl.gov/publications/i… 2/x
Using demographic data from solar adopters, @BerkeleyLab can parse the effects of different policies and business models. General subsidies do little to reach low-income customers, while leasing and PACE help a little. Most effective are direct LMI incentives. 3/x
Read 6 tweets
6 Nov 19
THREAD ALERT! Our annual “Tracking the Sun” report on distributed #solar is out! We have price, technology and other data from 1.6 million PV systems, representing 81% of the total installed through 2018. 1/x emp.lbl.gov/tracking-the-s…
@BerkeleyLab @BerkeleyLabETA @SEIA @CALSSA_org @CalEnergy @pvmagazineusa @ASES_Solar @SEPAPower @SolarPowerWorld @SolarIndustry Median installed prices for distributed #solar were $3.70/W for residential, $3.00/W for small non-residential, and $2.40/W for large non-residential systems last year, down 5-7% from 2017. 2/x
@BerkeleyLab @BerkeleyLabETA @SEIA @CALSSA_org @CalEnergy @pvmagazineusa @ASES_Solar @SEPAPower @SolarPowerWorld @SolarIndustry @SolarEnergyNews @SolarFred @SolarInMASS @POWERmagazine @ENERGY @drvox @FortnightlyMag @cleantechnica @greentechmedia @UtilityDive Distributed #solar prices have fallen by 50 cents per Watt annually since 2000, on average. Roughly 64% of that is due to module and inverter price declines, plus lower BoS and soft costs. 3/x
Read 10 tweets

Did Thread Reader help you today?

Support us! We are indie developers!


This site is made by just two indie developers on a laptop doing marketing, support and development! Read more about the story.

Become a Premium Member ($3/month or $30/year) and get exclusive features!

Become Premium

Too expensive? Make a small donation by buying us coffee ($5) or help with server cost ($10)

Donate via Paypal Become our Patreon

Thank you for your support!

Follow Us on Twitter!

:(