This thread examines vaccination data from April and May (to date). It also looks at state/zone level, and some priority behavior by states.
All data from MOHFW and PIB daily reports:
pib.gov.in/allRel.aspx
mohfw.gov.in
First, an aggregate picture:
1/
All data from MOHFW and PIB daily reports:
pib.gov.in/allRel.aspx
mohfw.gov.in
First, an aggregate picture:
1/
Observations:
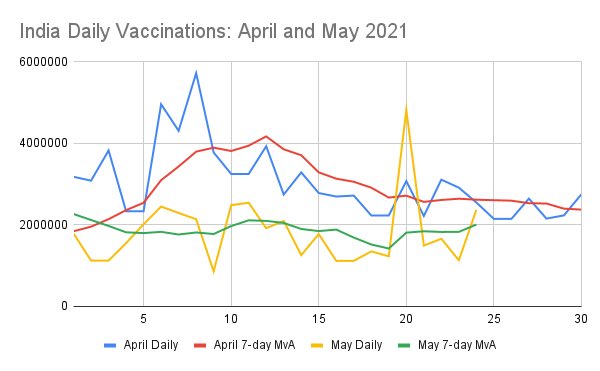
It has regularly been stated that April saw extremely high vaccination. In total numbers, this is true, over 90 million, increasing from 64M to 154M. However, daily data shows this is heavily biased to the first half.
2/
It has regularly been stated that April saw extremely high vaccination. In total numbers, this is true, over 90 million, increasing from 64M to 154M. However, daily data shows this is heavily biased to the first half.
2/
The April 7 day vaccination moving average drops to well below 3m/day in the second half of the month. And end of month it is 2.3M/day. May performance on the other hand has touched 2m/day as of May 24.
3/
3/
These numbers ‘look different’ from daily vaccination data. That is because all these are differentials - day n = cumulative to n - cumulative to n-1 . One would think this should match the daily figure. However it does not. This problem is also seen in CDC data.
4/
4/
For quite some time CDC data for US had trouble resolving which date to credit a vaccination. Indian data has shown a similar problem. This has worsened since May, because of reporting lag. The easiest way around this is take daily cumulative nums, then work back daily data.
5/
5/
Back to the chart, daily numbers show show convergence with April data. Two factors at play:
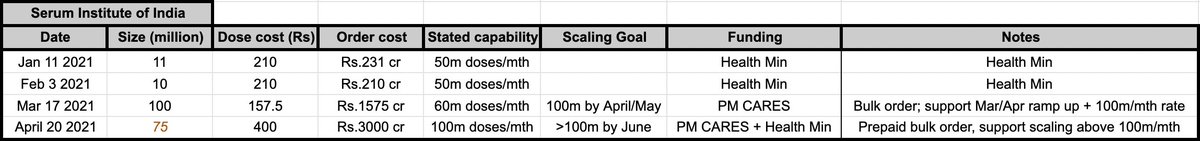
* Early April saw a large batch of vaccines delivered, increasing daily rate for ~2 weeks
* SII and BB started state deliveries only around 10 May onwards.
6/
* Early April saw a large batch of vaccines delivered, increasing daily rate for ~2 weeks
* SII and BB started state deliveries only around 10 May onwards.
6/
Now let us look at weekly vaccinations by major states for several weeks spanning from late March to present:
7/
7/


A very cursory picture of this is:
North - improving in May despite a drop latest week
East - steady in May
South - trending downwards
West - very irregular week to week data
8/
North - improving in May despite a drop latest week
East - steady in May
South - trending downwards
West - very irregular week to week data
8/
Another view of this data is to see week on week change in vaccinations for the same zonally-grouped sets of states. This is the same data as prior set of figures but shows week on week delta.
9/
9/
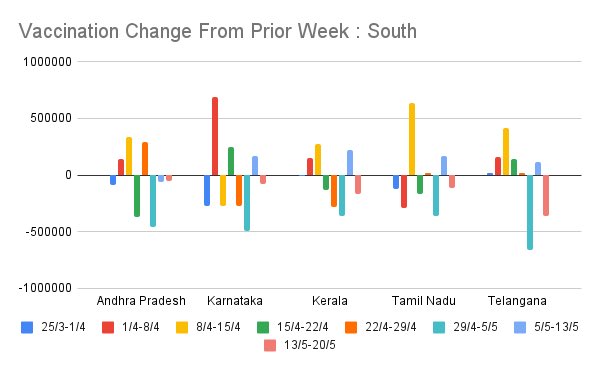

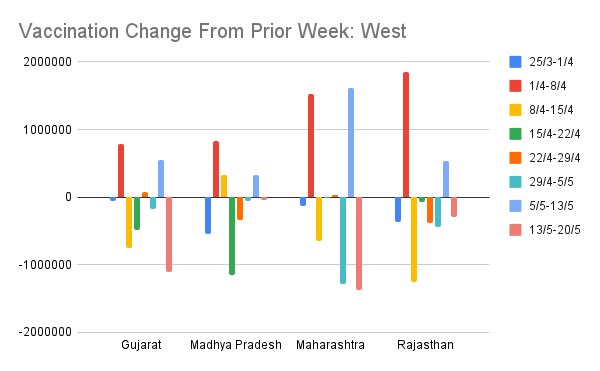
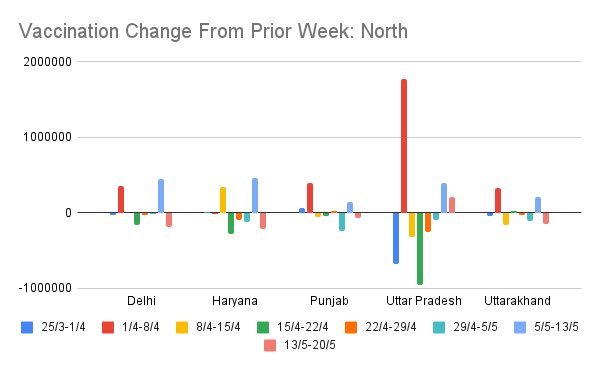
Some states (MH, WB) are characterized by very high oscillation in week on week vaccination rate. UP, RJ was like this in April, but has cut down a lot. This offers a picture of which states are managing steady supply/demand mgmt and which are having trouble.
10/
10/
Starting May, only 50% of vaccines go to center. We have seen that 2nd half of April 7DMA data is close to May figure. How do weekly May deliveries by state compare to 50% of average weekly deliveries in 2nd half of April :
11/
11/

This is a mixed bag. Some states are getting better than end-April supply. Others (AP, TG) are doing quite badly. Some have gained a lot in 3rd week of May. Overall, unless a state has hit 100% each week, it hasn’t entirely made up for the difference over April deliveries.
12/
12/
This leads to a related chart - how much do cumulative 18-44 vaccination per state comprise part of their vaccinations to date in May ?
13/
13/

Since states get to use upto 50% of their vaccinations for their own prioritization, this suggests 50% of doses should be for 18-44. However this is not the case. Most are 25% or less. AP/TG remains an outlier here.
14/
14/
Some general trends visible here:
1. First 2 weeks of May were the period it took for the supply to states to start stabilizing.
2. Daily data is not useful due to reporting lag . Day to day data is noisy but usable as a smoothed 7DMA figure.
15/
1. First 2 weeks of May were the period it took for the supply to states to start stabilizing.
2. Daily data is not useful due to reporting lag . Day to day data is noisy but usable as a smoothed 7DMA figure.
15/
3. Supply to states has a zonal pattern, with each zone doing differently. Trying to satisfy 30 states’ needs is hard. States may hate the center, but this affirms that it’s still better to let the center procure and apportion doses by statewise…
16/
16/
… This may not make any state really happy, but their troubles with independent procurement were wholly anticipated. In their haste to take charge, they forgot that the center has bargaining power that they lack.
17/
17/
How does SII or BB decide how apportion doses ? FCFS ? One large order blocks every state behind it. Round robin ? What if there’s more urgency in one state ? There is no truly perfect approach. Letting center decide was best here, and center decides based on state inputs.
18/
18/
An important piece of data I sought but could not find granular detail was production data. Right now this is opaque. However, to date, consumption, wastage, exports + stocks in pipeline total over 310m doses, just under previously estimated production to end April.
19/
19/
There’s clearly an upward trend in 7DMA data for May, potentially able to overtake the 2.3m figure at the end of April, which would mean by end May the vaccination rate wound trend towards the highs of early April again.
20/
20/
Problems still remain - some states are seeing much better situation than others. There was an argument that stocks were entirely exhausted end April. This is false.
pib.gov.in/PressReleasePa…
21/
pib.gov.in/PressReleasePa…
21/

However, it is clear incremental supplies and especially consistency of week on week supplies remains a problem. Inconsistent supplies means vaccination drives are hard to plan. This needs to be resolved, at least to ensure consistency, which enables planning.
22/
22/
Early in April, I projected that May would present a demand/supply problem. This happened. The situation was also projected to ease by end May. That is happening now. As difficult as this period has been, the supply picture should improve significantly going forward.
23/23
23/23
• • •
Missing some Tweet in this thread? You can try to
force a refresh