The FBI use of force data collection is a joke. They track substantially fewer incidents than we’ve already published online at mappingpoliceviolence.org and they say they won’t publicly share their data anytime soon. A distraction.
They could supplement their data collection by referencing media reports and existing databases (MPV, Fatal Encounters, WaPo) but instead they decided to rely *solely* on voluntary data collection from 18,000 police agencies, 73% of which aren’t currently choosing to participate.
They could decide to publish the data they *have* collected, which covers 27% of agencies. At least we could do something with that. But nope, the FBI decided they won’t share any department-level data until 80% of law enforcement participates - which likely will never happen.
Honestly you couldn’t make up a more useless program until you realize the FBI is running it and they have an interest in appearing to be doing something about police violence without doing anything that would actually promote basic transparency and accountability in policing.
It’s like one bit distraction that serves the interests of the police and the feds, while leaving journalists thinking that this program actually is a real thing that might someday matter - it won’t and that’s by design.
Meanwhile *the data already exists* and its *public* and the federal government, despite their best efforts, could not do what the people have already done - compiled comprehensive data on fatal police violence without depending entirely on the police to report the data.
Data on fatal police violence has *been* published at mappingpoliceviolence.org and FatalEncounters.org. Detailed analyses of nonfatal police shootings/use of force are published at policescorecard.org . There’s more than enough data, already, to make the necessary changes.
• • •
Missing some Tweet in this thread? You can try to
force a refresh
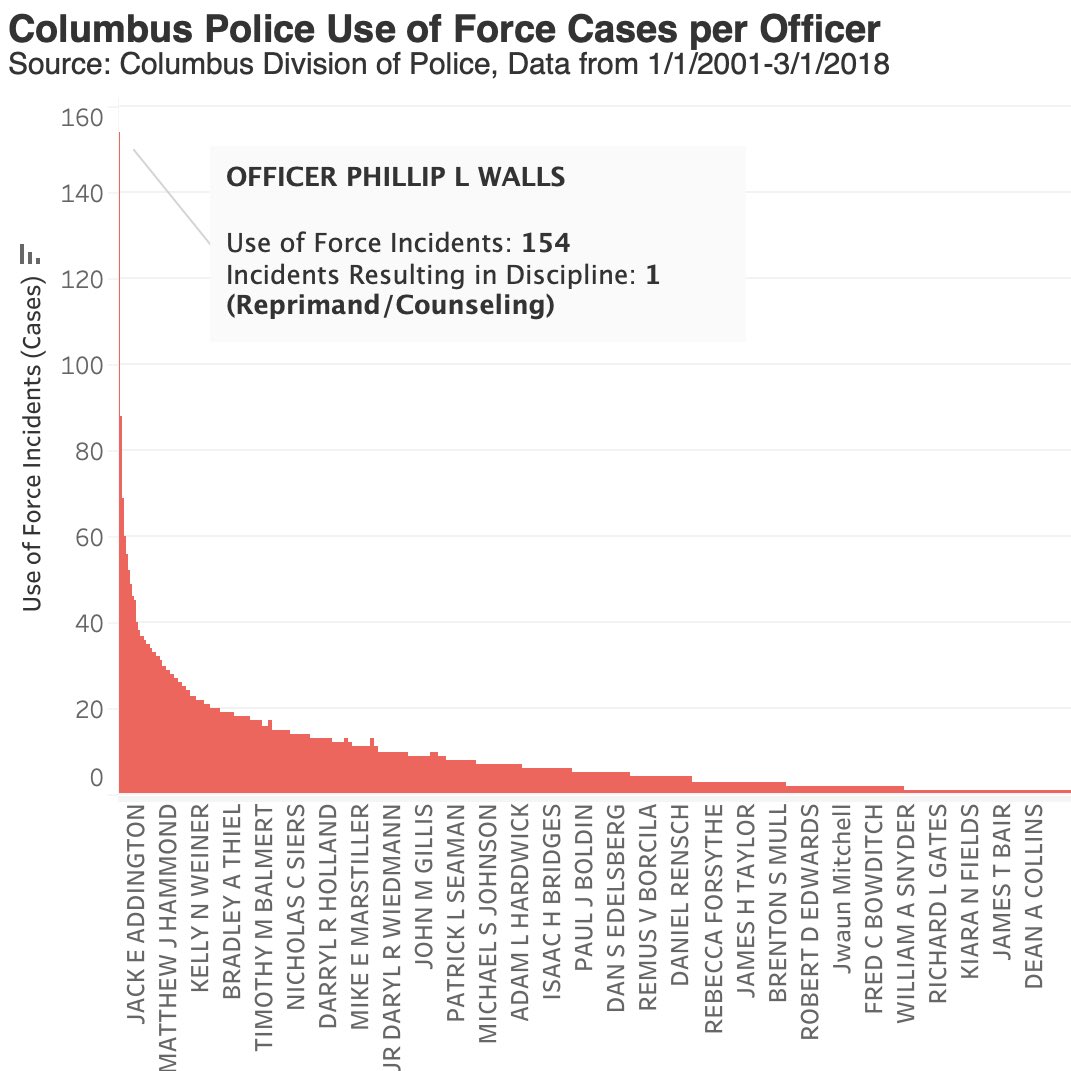
Here’s how often each Columbus police officer used force against people from 2001-2018. Some used force at substantially higher rates. But how often were they held accountable? A thread. (1/x)
Regardless of how much force they used, few officers were disciplined. 99% of incidents resulted in no discipline. Even for the officers with the worst records. Among officers who used the most force (40+ cases), only 1 officer was disciplined more than reprimand/counseling.(2/x)
That one officer in the group who was suspended was Adam Coy. But he wasn’t fired until last year when he killed Andre Hill, an unarmed Black man. He was charged with murder in February and facing trial. But this wasn’t a surprise given the data. Let’s take another look... (3/x)
First, Maryland repealed its police bill of rights law that gave special protections to officers accused of misconduct. That law put police in charge of holding themselves accountable and kept communities from having insight into the process. That’s being replaced with... (2/x)
It’s replaced with a new system that empowers community. Each county will have a community-led police accountability board that appoints members to a committee that formally charges officers with misconduct. Police chief can increase, but not reduce, the recommended discipline.
The Governor of Georgia lives in a mansion that is upkept by prison laborers. Most are Black. According to the GA Department of Corrections, “these residents are not paid any wages.” dcor.state.ga.us/Divisions/Faci…
These incarcerated workers are classified by prison system as “Maintenance Residents” who work full time maintaining the Governor’s mansion and other state government facilities. powerdms.com/public/GADOC/d…
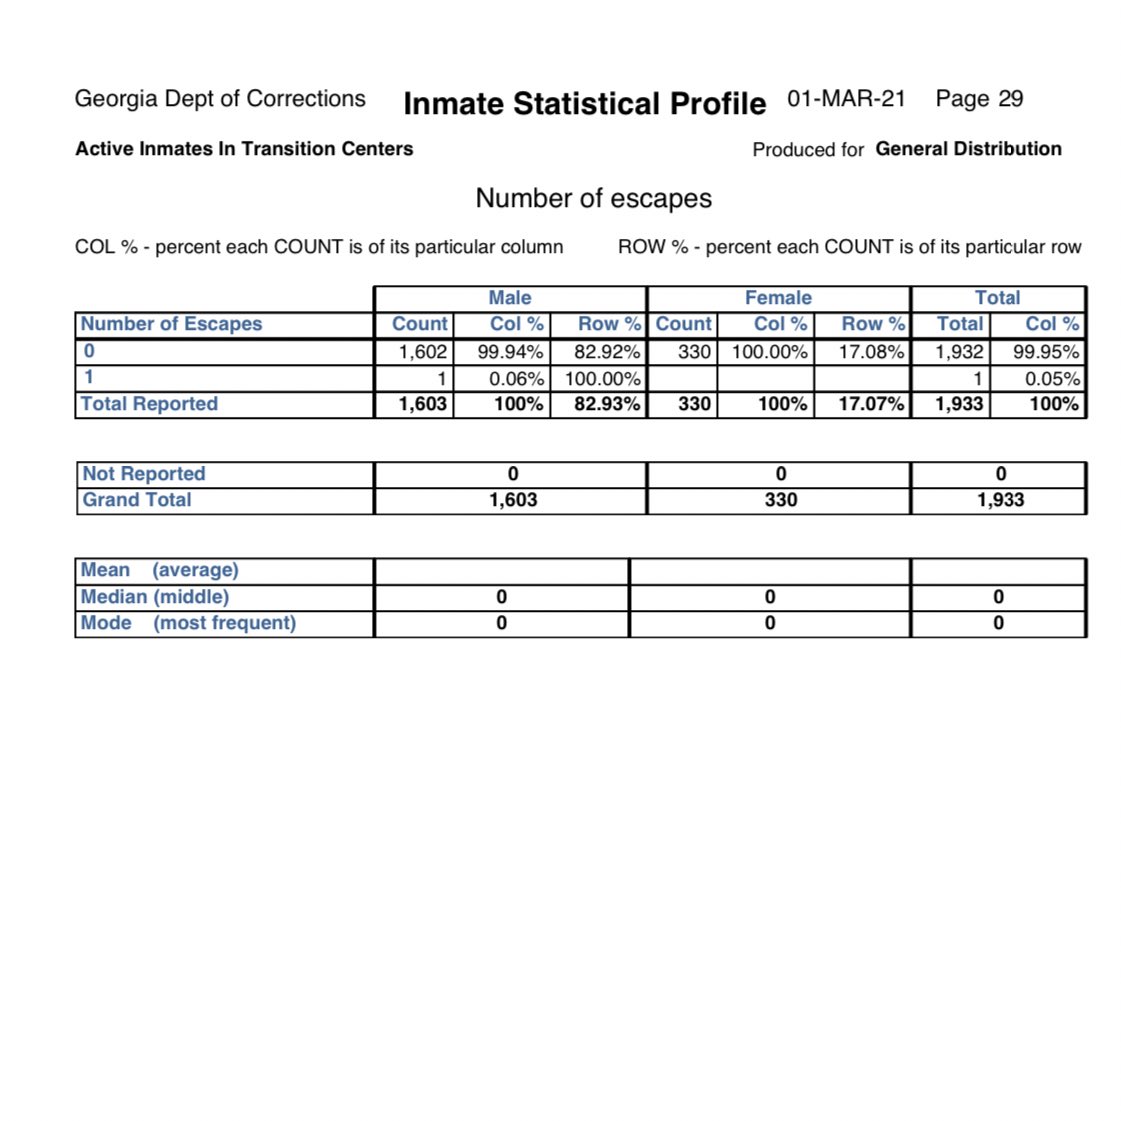
The state of Georgia methodically tracks these incarcerated workers. Regular schedules posted by age, race, religion, weight, IQ scores, reading scores, physical/medical tests. How many attempted escapes there were. 21st century slave schedules. gdc.ga.gov/sites/all/them…
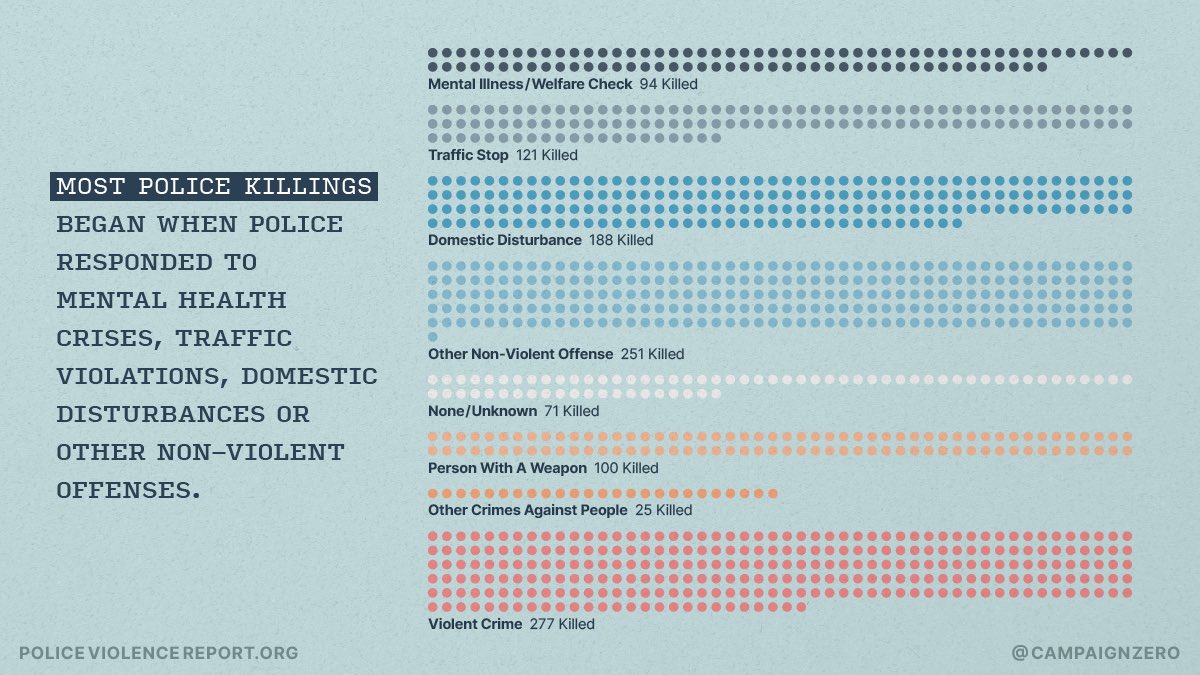
We analyzed data on 1,127 killings by police in 2020 - finding alternative responses to mental health, traffic violations and other non-violent situations could substantially reduce fatal police violence nationwide. A thread (1/x). policeviolencereport.org
Working with an incredible team of data analysts (h/t @moncketeer@MaryLagman@KirbyPhares@backspace), we compiled media reports, official statements and other info on how each incident began, what reportedly happened during the encounter and whether officers were charged.
First, 2020 was largely in line with a longstanding pattern of ~1,100 killings by police per year since at least 2013. The lockdown, economic crisis, changes in crime, etc didn’t appear to change this trend, the overall pace of fatal police violence in America.
There’s growing evidence that there has been a substantial decline (~30-40%) in police shootings/killings *in major cities* since the protests started in 2014. I’ve written about this here. But WHY the reduction in cities and why not other places? Well... fivethirtyeight.com/features/polic…
Now this is where it gets complicated. Because the places that saw the biggest reductions in police violence seem to share a set of common factors, some of which might’ve contributed and others which might not have. For example...
Arbitration is essentially the qualified immunity of officer discipline. While qualified immunity prevents families from receiving financial payouts from the city for misconduct, arbitration prevents cities from actually holding those individual officers accountable.
Because holding officers accountable has historically been the exception, not the rule, both qualified immunity and arbitration tie current practices to past precedents in a way that blocks the expansion of financial or administrative accountability for police violence in the US.
Both qualified immunity and arbitration are important practices to target for change via legislation. The focus on ending qualified immunity - which won’t actually hold those officers accountable (due to indemnification) must be expanded to include a focus on arbitration as well.