Here are some charts showing what is going on with Covid cases and hospitalizations in England.

A thread.

Firstly, cases. In order that the graph doesn't get too spiky, we smooth it by taking the average cases in the previous 7 days. Here it is.
We're only really interested in what's happening now (and in the future), so let's look at the right hand bit. Cases are rising exponentially.
To show this, we can plot the case numbers on a logarithmic plot. If there's an exponential rise, this line should be straight.
Actually, it's a bit worse than that. We can plot the rate at which cases are growing. If cases are growing at a constant rate (which is exponential growth), we would expect the growth rate to be the same (say doubling every 10 days). But the *rate* of growth is increasing.
There are bank holiday effects plus Step 3 of the Roadmap which happened on 17 May which makes things a little confused, but basically, it's Not Good.

Let's put the case numbers and the growth rate on the same chart.
Now, you say, cases don't matter - it's all about hospitalizations. That's certainly what we've been told - hospitalizations 'decoupled' from cases. Not sure where that phrase came from, but there we go.

Here are 7 day average hospitalizations.
Let's look at the right hand side, from the beginning of April.

Hospitalizations are rising.
And here's the growth rate of weekly hospitalizations. It's growing at 19% per week and appears to be rising too.
And that's why some people are concerned.

We already have a backlog of non-Covid hospitalizations. It doesn't take *that* many Covid hospitalizations to make things quite critical for the health system.

We need more data, but the data we have so far isn't encouraging.
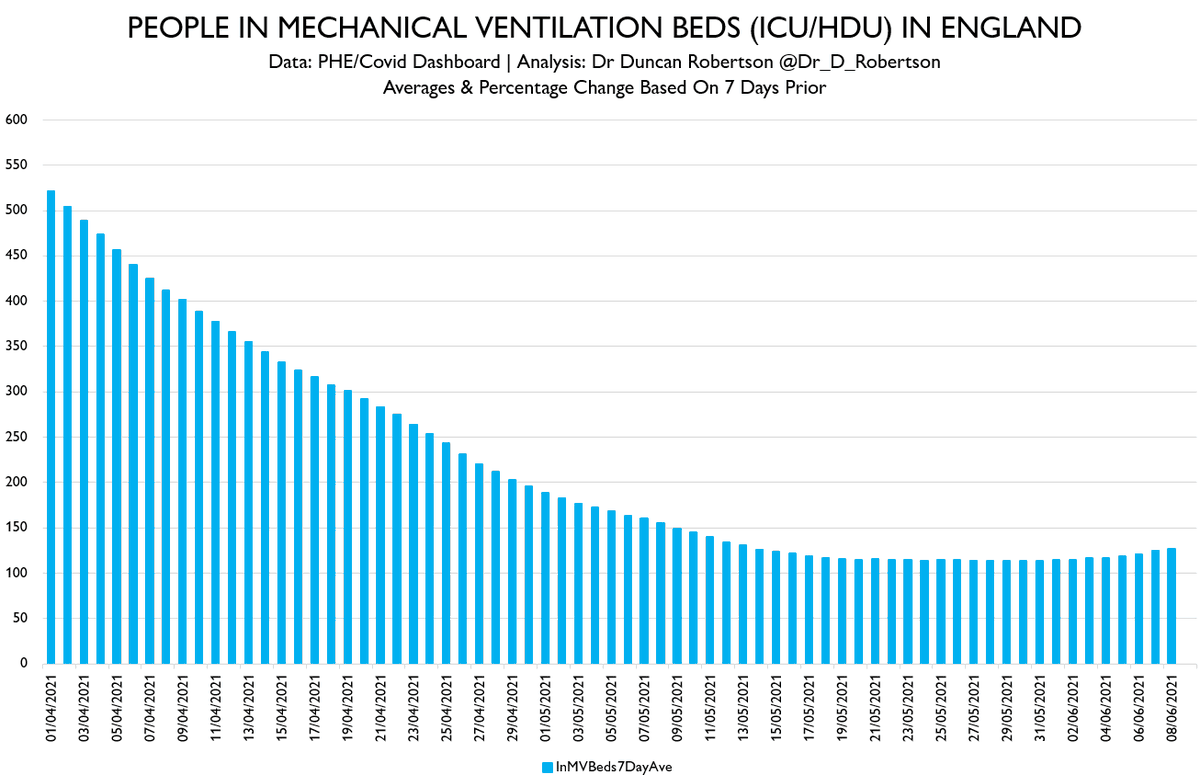
And one final point: the number of people in mechanical ventilation beds (ICU/HDU) is also increasing.

The chart below shows the number of people in these beds.
Here's the chart for the number of people in mechanical ventilation beds (ICU/HDU) from 1 April 2021.

A slow but definite increase.

• • •

Missing some Tweet in this thread? You can try to force a refresh
 

Keep Current with Dr Duncan Robertson

Dr Duncan Robertson Profile picture

Stay in touch and get notified when new unrolls are available from this author!

Read all threads

This Thread may be Removed Anytime!

PDF

Twitter may remove this content at anytime! Save it as PDF for later use!

Try unrolling a thread yourself!

how to unroll video
  1. Follow @ThreadReaderApp to mention us!

  2. From a Twitter thread mention us with a keyword "unroll"
@threadreaderapp unroll

Practice here first or read more on our help page!

More from @Dr_D_Robertson

11 Jun
I want to talk about 'decoupling'.

A thread.

The Government's reason for proceeding with the 17 May Step 3 unlocking was that vaccination means that cases are 'decoupled' from hospitalizations.

Here's the quote in Hansard.

hansard.parliament.uk/Lords/2021-05-… ImageImage
The problem is: it's not clear to me that cases and hospitalizations *have* become decoupled.

It's worth reading this in conjunction with the SPI-M advice available to Government prior to Step 3 unlocking.

SPI-M's projection based on a variant (e.g. Delta/B.1.617.2) being more transmissible.
Read 18 tweets
8 Jun
Let's look back at the SPI-M consensus statement from before Step 3 of the Roadmap.

A short thread.

assets.publishing.service.gov.uk/government/upl…
Read 12 tweets
6 Jun
We are now here.
The source from this chart is Figure 2 of the SPI-M-O consensus statement of 12 May, a few days before we moved to Step 3 of the Roadmap.

assets.publishing.service.gov.uk/government/upl…
The figure comes from the Warwick/JUNIPER Road Map scenarios

assets.publishing.service.gov.uk/government/upl…
Read 11 tweets
3 Jun
Cumulative case numbers for variants published by PHE today, 3 June.

I think we all get the picture now that the Delta/B.1.617.2/'India' variant is becoming dominant.

Here are the charts.

And a final tweet linking to today's risk assessment of Delta, which isn't great news.
Logarithmic cumulative chart.
Heatmaps of weekly cases
Read 7 tweets
3 Jun
The PHE risk assessment of Delta/B.1.617.2/'India' has been updated today, 3 June.

- *new* INFECTION SEVERITY risk assessed as RED (with Iow confidence)
- VACCINES risk still assessed as RED but now with HIGH confidence.

Previous versions linked below.

A thread.
TRANSMISSIBILITY BETWEEN HUMANS
RED risk
HIGH confidence

"Transmissibility appears greater than wild type (first wave) SARS-CoV-2Delta continues to demonstrate a substantially increased growth rate compared to Alpha, across multiple analyses. ...
"... Delta cases are rising whilst Alpha cases are declining. Secondary attack rates, including household secondary attack rates, are higher for Delta, but these are not yet corrected for vaccination status. There is in vitro evidence suggestive of increased replication in ...
Read 19 tweets
3 Jun
What is the 'Nepal Variant'?

This is the Transport Secretary's statement just now, justifying why Portugal has moved from the green list of countries.

"a sort of Nepal mutation of the so-called Indian variant which has been detected"
This was featured prominently in today's Daily Mail.
The World Health Organization apparently do not know about it.

Read 7 tweets

Did Thread Reader help you today?

Support us! We are indie developers!


This site is made by just two indie developers on a laptop doing marketing, support and development! Read more about the story.

Become a Premium Member ($3/month or $30/year) and get exclusive features!

Become Premium

Too expensive? Make a small donation by buying us coffee ($5) or help with server cost ($10)

Donate via Paypal Become our Patreon

Thank you for your support!

Follow Us on Twitter!

:(