I want to talk about 'decoupling'.
A thread.
The Government's reason for proceeding with the 17 May Step 3 unlocking was that vaccination means that cases are 'decoupled' from hospitalizations.
Here's the quote in Hansard.
hansard.parliament.uk/Lords/2021-05-…
A thread.
The Government's reason for proceeding with the 17 May Step 3 unlocking was that vaccination means that cases are 'decoupled' from hospitalizations.
Here's the quote in Hansard.
hansard.parliament.uk/Lords/2021-05-…


The problem is: it's not clear to me that cases and hospitalizations *have* become decoupled.
It's worth reading this in conjunction with the SPI-M advice available to Government prior to Step 3 unlocking.
It's worth reading this in conjunction with the SPI-M advice available to Government prior to Step 3 unlocking.
https://twitter.com/Dr_D_Robertson/status/1402293608569524224
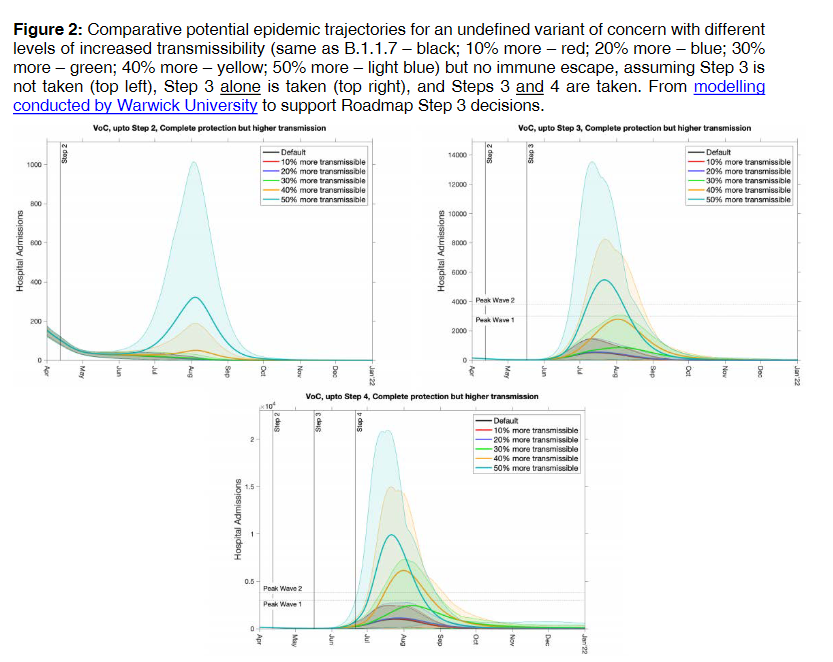
SPI-M's projection based on a variant (e.g. Delta/B.1.617.2) being more transmissible.
https://twitter.com/Dr_D_Robertson/status/1401491359970758660
We know that Delta is around *60%* more transmissible (with a lot of uncertainty).
https://twitter.com/Dr_D_Robertson/status/1403283308616851458
Anyway, let's look at cases and hospitalizations.
There are three phases.
- before mass testing
- mass testing
- vaccination
There are three phases.
- before mass testing
- mass testing
- vaccination
I have plotted:
- cases (purple, left hand scale) and
- hospitalizations (red, right hand scale)
- cases (purple, left hand scale) and
- hospitalizations (red, right hand scale)

Now, these graphs may look similar, but the problem is when there are low case or hospitalization numbers, it's tricky to see what's going on. If hospitalizations were to double from 2 to 4 to 8 we wouldn't see it on this graph, so we need some way of showing doubling.
Let's plot the same chart on an exponential chart. This also allows us to plot the cases and hospitalizations on the same scale.
Hospitalizations certainly appear to have reduced due to the vaccine effect, which is great.
Hospitalizations certainly appear to have reduced due to the vaccine effect, which is great.

We can see phase 1 - where most of the cases were detected in hospitals, so the hospitalization and case lines are very similar.
Then mass testing where there is a constant-ish distance between the two lines.
And the vaccine effect coupled with a new variant from May 2021.
Then mass testing where there is a constant-ish distance between the two lines.
And the vaccine effect coupled with a new variant from May 2021.
If cases and hospitalizations were now *completely* decoupled, it would be difficult to find a relationship between the cases and hospitalization lines.
Let's look from the beginning of January to see what is happening.
Let's look from the beginning of January to see what is happening.

I think it's pretty clear that hospitalizations are not going up at the rate of cases.
*But* this is to be expected. Becuase there is a delay for cases to be translated into hospitalizations.
*But* this is to be expected. Becuase there is a delay for cases to be translated into hospitalizations.
Instead of looking at the cases themselves, let's look at the increase compared to the previous week.
Can we see a pattern? But remember, hospitalizations *lag* cases.
Can we see a pattern? But remember, hospitalizations *lag* cases.

So let's shift cases back by 11 days (this takes into account reporting delays and the time over which we have calculated averages).

Now let's just look at the North West of England.

We may be able to get better graphs by plotting by case specimen date rather than reporting date. We could also split by age of cases.
But the main point is that it is too early to say that cases and hospitalizations are decoupled.
But the main point is that it is too early to say that cases and hospitalizations are decoupled.
For the Government to make decisions on the basis that cases and hospitalizations are decoupled would be reckless.
As ever, these are political decisions.
And we shall see the more detailed modelling on Monday.
As ever, these are political decisions.
And we shall see the more detailed modelling on Monday.
*Nobody* wants to go back to another lockdown. The reason this could happen would be (like Lockdown 1, Lockdown 2, and Lockdown 3) that hospitals become overwhelmed and there was a threat to the health system.
The Government promised to use Data not Dates.
And cases and hospitalizations are rising.
And cases and hospitalizations are rising.
https://twitter.com/Dr_D_Robertson/status/1402695567030038530
• • •
Missing some Tweet in this thread? You can try to
force a refresh