Identifying Market Structure 📚
A market structure tells you what trend an asset is moving in.
1/7
A market structure tells you what trend an asset is moving in.
1/7
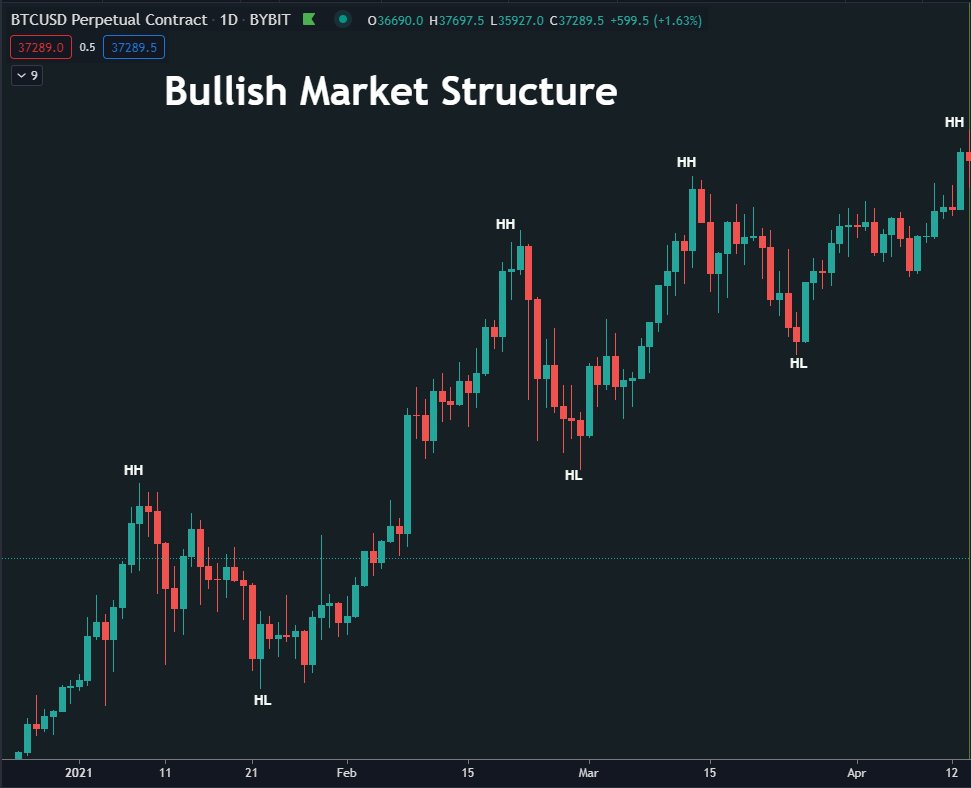
🔹Bullish Market Structure
Has higher highs and higher lows. This example is on the daily.
You could point out a few levels where, looking at the week before, price technically made a lower low.
But it's mainly about the general bigger movements price makes.
2/7
Has higher highs and higher lows. This example is on the daily.
You could point out a few levels where, looking at the week before, price technically made a lower low.
But it's mainly about the general bigger movements price makes.
2/7
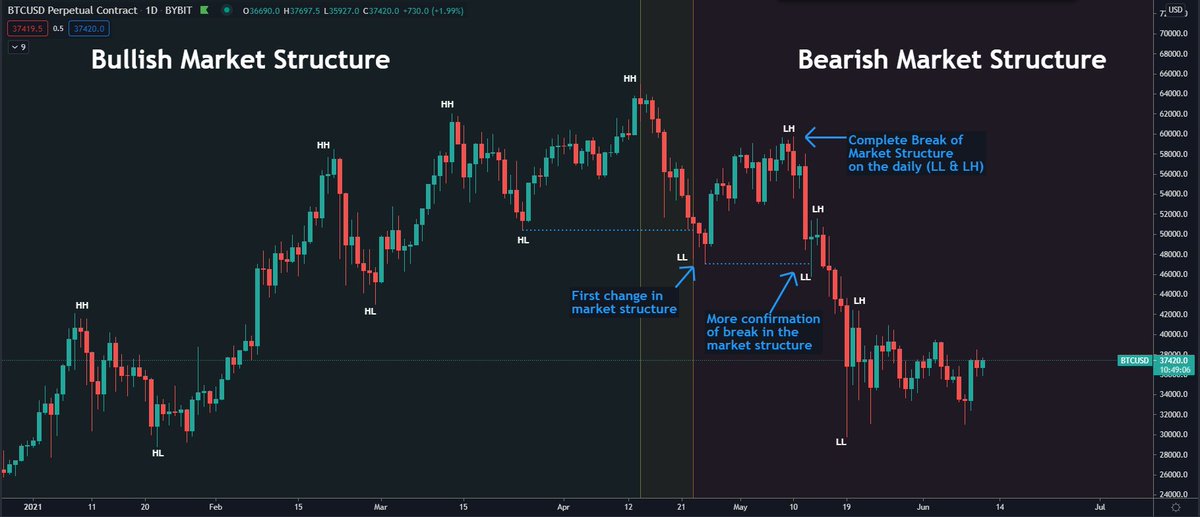
🔹Bearish Market Structure
Here we can see price is consistently making lower highs and lower lows. This was a big change from what we saw on the run up to $65K.
Currently, price is moving sideways but still has to make a higher high on the daily to really see a reversal.
3/7
Here we can see price is consistently making lower highs and lower lows. This was a big change from what we saw on the run up to $65K.
Currently, price is moving sideways but still has to make a higher high on the daily to really see a reversal.
3/7

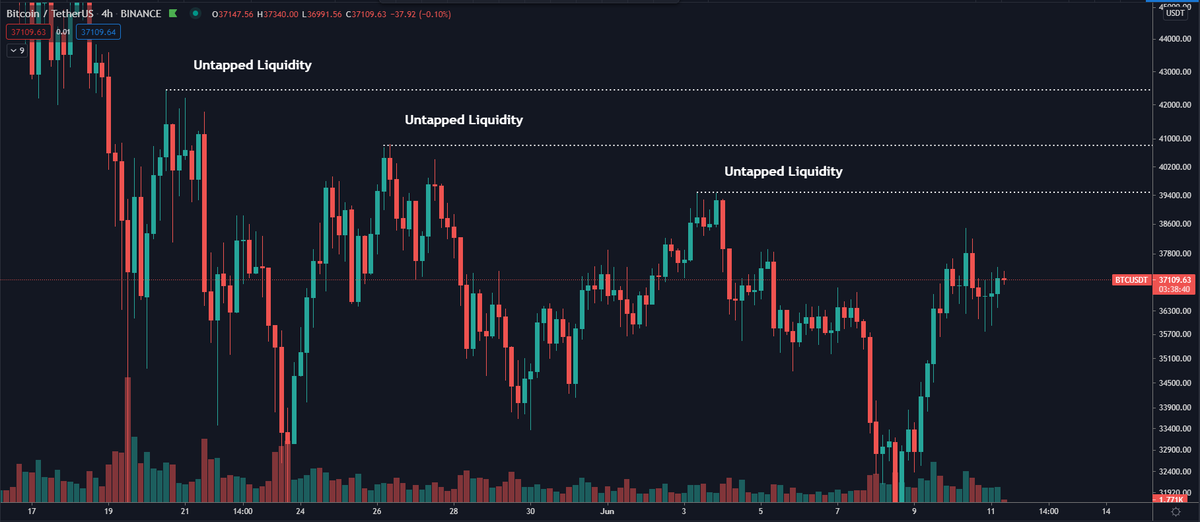
It's possible to identify market structure on all timeframes!
While looking at the January 2021 consolidation on the 4 hour candlesticks, we can zoom in and identify a lot more pivot points.
This can often give you an idea about a low timeframe trend.
4/7
While looking at the January 2021 consolidation on the 4 hour candlesticks, we can zoom in and identify a lot more pivot points.
This can often give you an idea about a low timeframe trend.
4/7

But as can be seen from the picture above, this can also cause a lot of false signals and make you flip flop a lot while price is usually just consolidating sideways in a range.
That's why zooming out often gives a good overview of what the higher timeframe trend is.
5/7
That's why zooming out often gives a good overview of what the higher timeframe trend is.
5/7
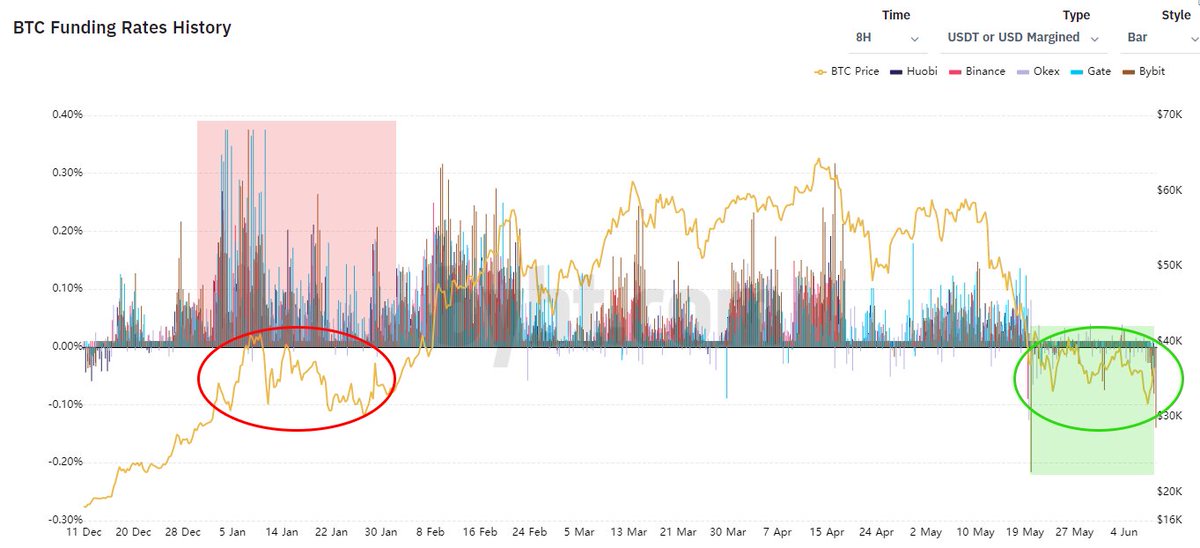
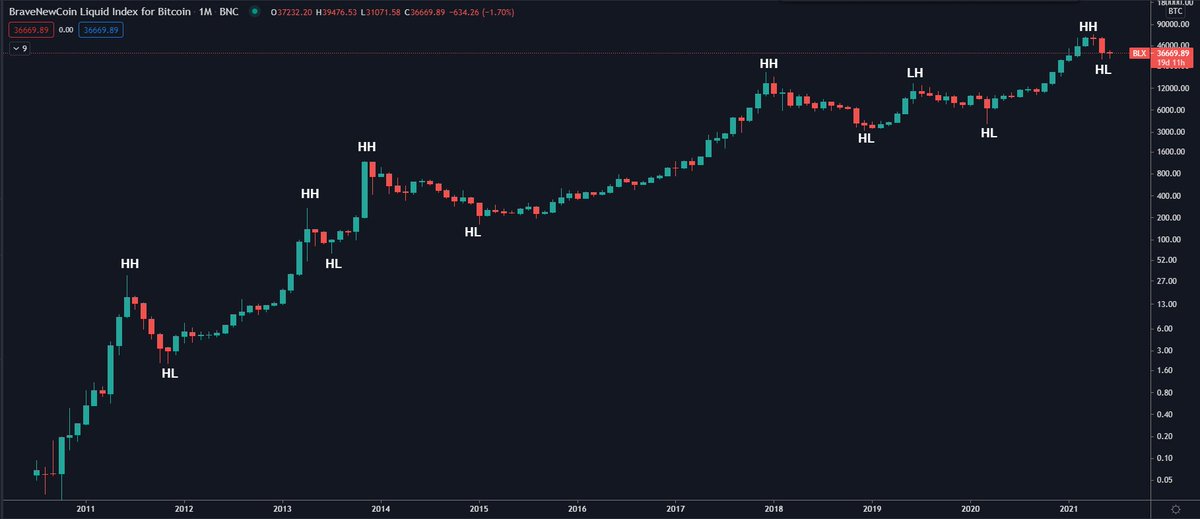
For example: $BTC's daily may be in a bearish market structure as we speak.
But the monthly tells another story.
6/7
But the monthly tells another story.
6/7
It's useful to identify an asset's market structure on different timeframes to see what directional trade you should be focussing on that has the highest probability.
Any reversal starts on low timeframes and then slowly moves over to the higher timeframes.
Good luck! 📈📉
7/7
Any reversal starts on low timeframes and then slowly moves over to the higher timeframes.
Good luck! 📈📉
7/7
• • •
Missing some Tweet in this thread? You can try to
force a refresh