$BTC Then vs Now.
Sentiment Check at $30-40K.
Sentiment Check at $30-40K.

1. Fear and Greed Index
Then: 90+ Extreme Greed.
Now: <20 Extreme Fear.
Then: 90+ Extreme Greed.
Now: <20 Extreme Fear.

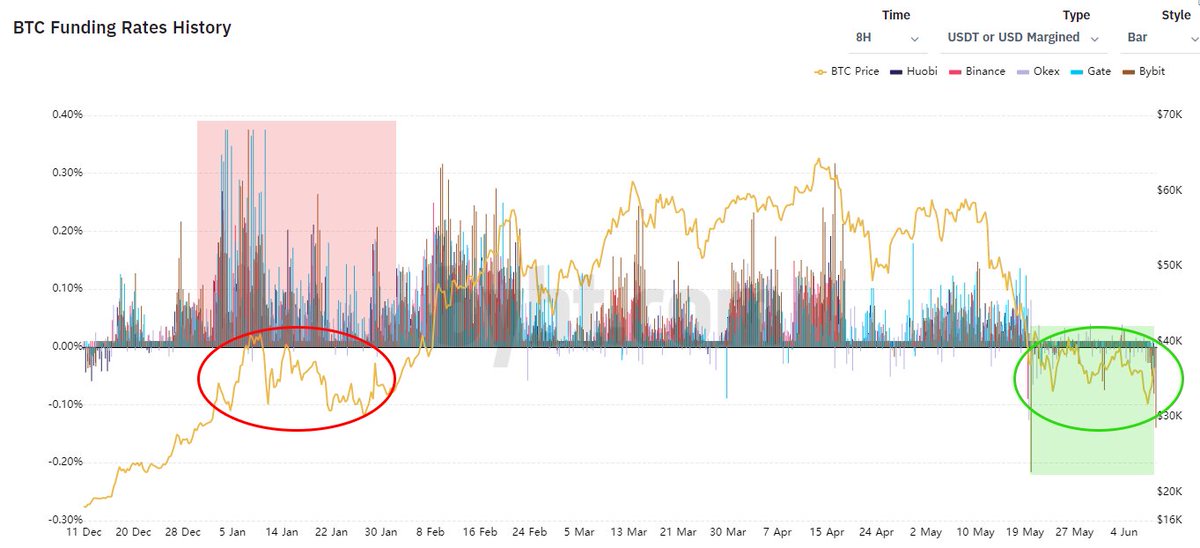
2. Funding Rates
Then: Consistent 0.1%+ on most exchanges
Now: -0.05 to 0.01% mostly.
Then: Consistent 0.1%+ on most exchanges
Now: -0.05 to 0.01% mostly.
3. Google Trends for "Bitcoin"
Then: 40-75
Now: ~30
Then: 40-75
Now: ~30

4. Twitter Sentiment

5. Crypto Twitter Drama

5 months time and a lot of previous price action can do a lot to a market.
Up to you to decide whether $BTC's fundamentals have meanwhile improved or not.
The general public seems to have a darker outlook on BTC compared to Jan 2021 when price first visited the $30-40K levels.
Up to you to decide whether $BTC's fundamentals have meanwhile improved or not.
The general public seems to have a darker outlook on BTC compared to Jan 2021 when price first visited the $30-40K levels.
If this Then vs Now concept is something people seem to like, I could start a little series for other periods of time or occurances. If I can get the data of course 🙂
For example: Then vs Now "Cycle tops".
For example: Then vs Now "Cycle tops".
• • •
Missing some Tweet in this thread? You can try to
force a refresh