1/ Following up, I built a system that scans the #COVID19SL press-releases published on the @infodprtsl website (dgi.gov.lk) for structured information - like statistics, isolated areas etc.
Output is at github.com/nuuuwan/nopdf_… and is updated every few hours.
↓
Output is at github.com/nuuuwan/nopdf_… and is updated every few hours.
↓
https://twitter.com/nuuuwan/status/1403763108737433607
2/ The output contains,
- Copies of the original press-releases (JPEGs)
- Plain text, from #OCR
- Structured information as JSON
- A summary structured information in #Markdown
(All updated every few hours)
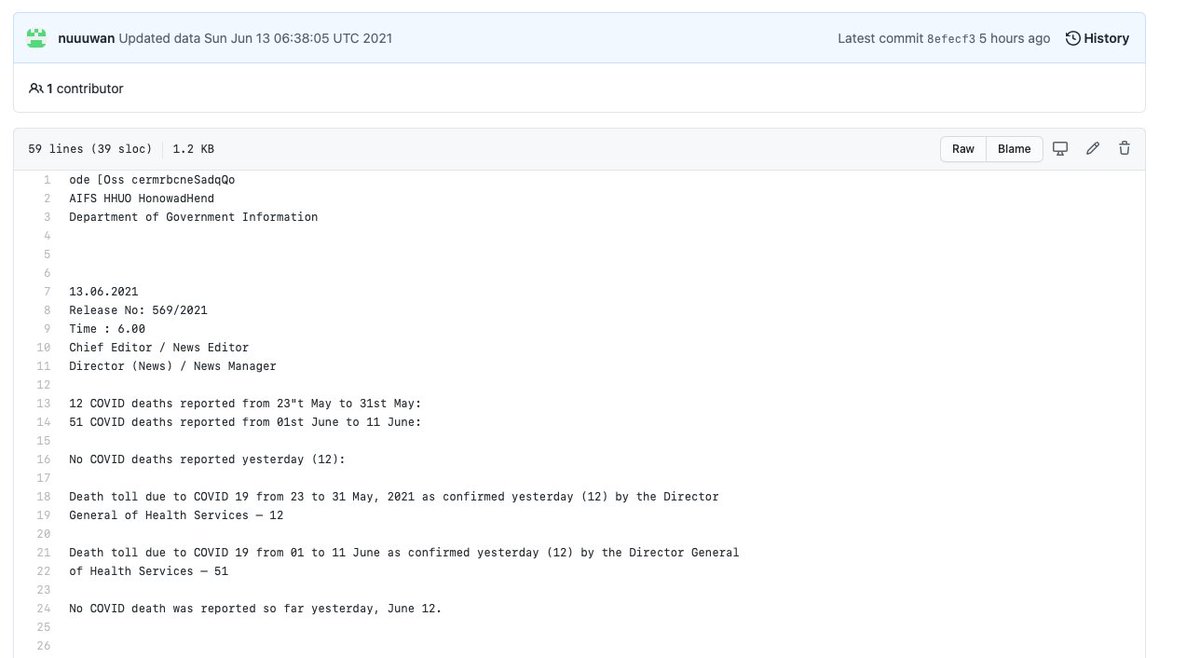
E.g. here's the output for the press-release published today (June 13):


- Copies of the original press-releases (JPEGs)
- Plain text, from #OCR
- Structured information as JSON
- A summary structured information in #Markdown
(All updated every few hours)
E.g. here's the output for the press-release published today (June 13):


3/ The information might be useful data analysts, medical researches and journalists.
cc: @Rumindahg @Minimalneg @sanjiva @ruvanw @kataclysmichaos @himalkk @NCdeMel @VeriteResearch @ihplk
#lka #SriLanka #CoVID19SL
cc: @Rumindahg @Minimalneg @sanjiva @ruvanw @kataclysmichaos @himalkk @NCdeMel @VeriteResearch @ihplk
#lka #SriLanka #CoVID19SL
4/ This is the result of a somewhat hasty weekend project. Please comment or DM me, if you notice any bugs, incorrect results, or inconsistencies.
Feel free to add to or fork the code from github.com/nuuuwan/nopdf.
#lka #SriLanka #CoVID19SL @ThePSF
Feel free to add to or fork the code from github.com/nuuuwan/nopdf.
#lka #SriLanka #CoVID19SL @ThePSF
5/ To summarise,
If you want the CODE, goto
github.com/nuuuwan/nopdf
If you want the DATA and INFORMATION, goto
github.com/nuuuwan/nopdf_…
#SriLanka #lka #CoVid19SL
If you want the CODE, goto
github.com/nuuuwan/nopdf
If you want the DATA and INFORMATION, goto
github.com/nuuuwan/nopdf_…
#SriLanka #lka #CoVid19SL
• • •
Missing some Tweet in this thread? You can try to
force a refresh


