I’ve updated my #Missouri #COVID19 website for Saturday, 6/19 - slu-opengis.github.io/covid_daily_vi…. A few highlights are below 👇.

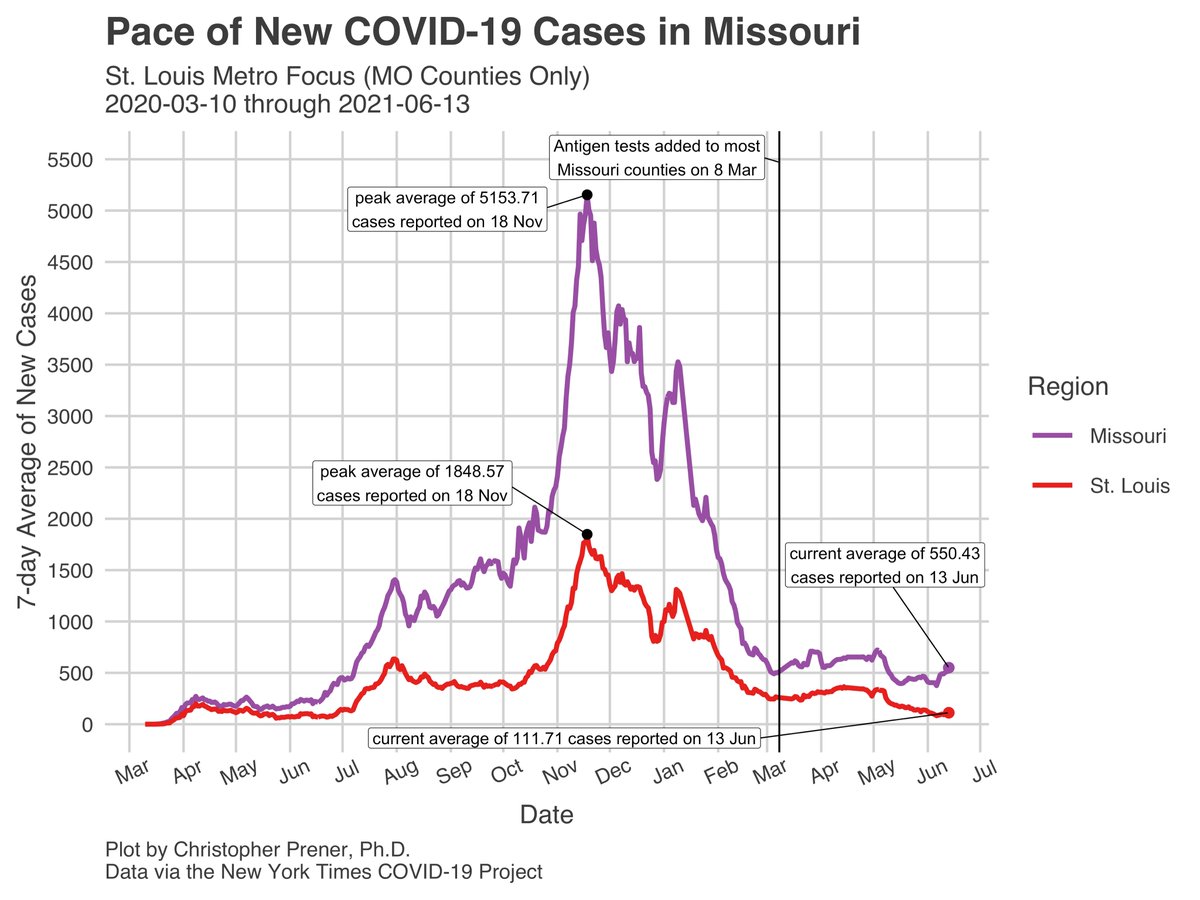
Our statewide 7-day average is now the highest in the United States, and "outstate" is making up 69% of those new cases each day on average.

1/9
In Northern MO, things are slowly improving in the recently hard-hit trio of Putnam, Linn, and Livingston counties. Linn's 7-day average, however, remains in the top 10 nationwide for counties with more than 10,000 residents. 2/9
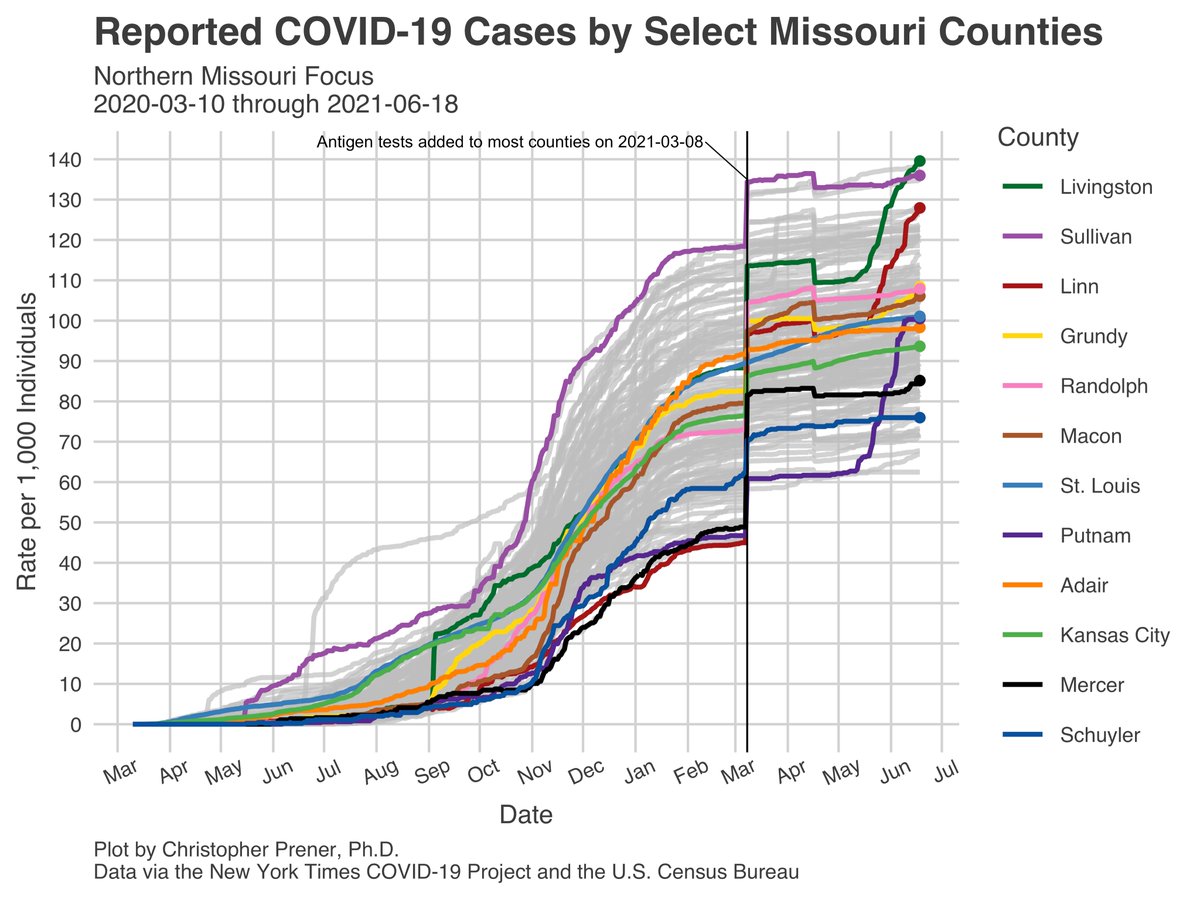
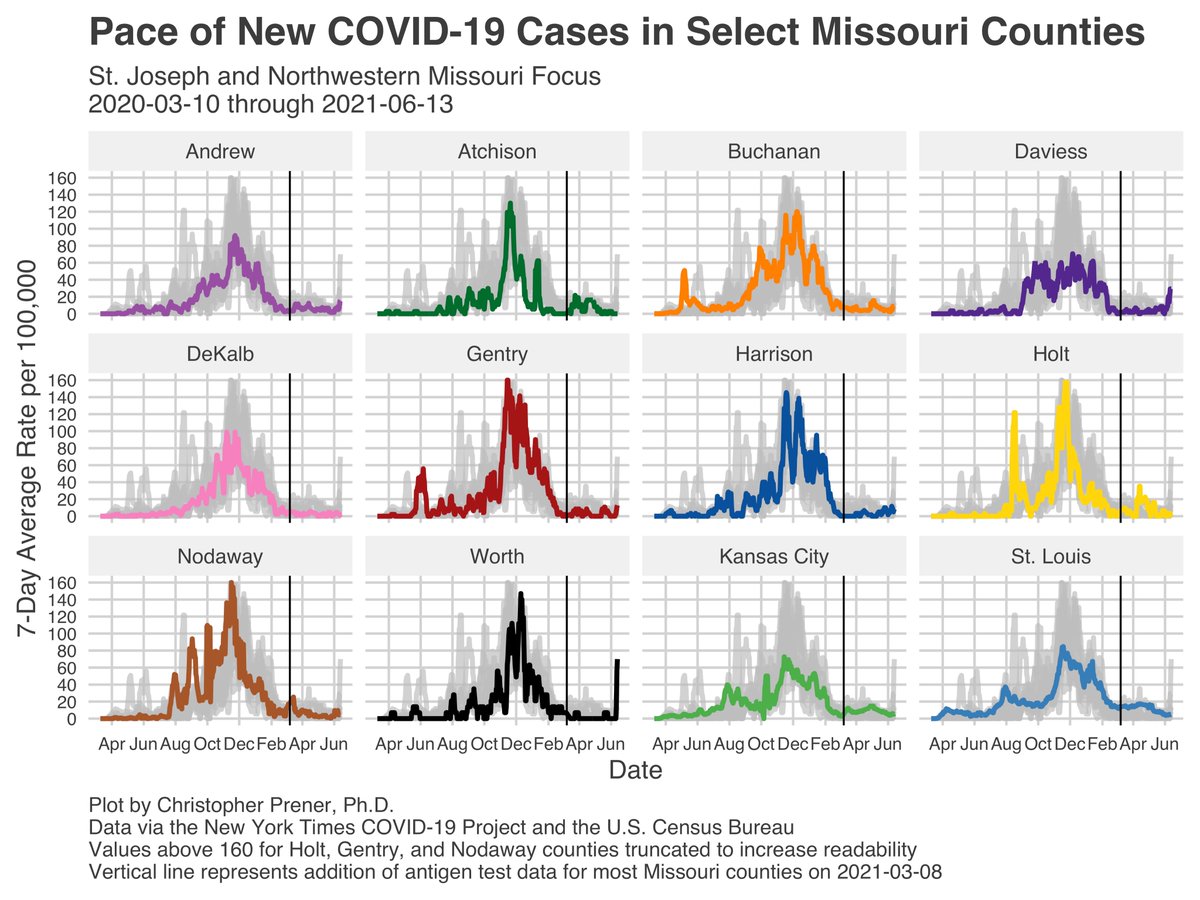
I'm concerned about cases shifting from these counties outward, though. Neighboring counties, like Grundy, Macon, and Mercer are worth watching. To the west near St. Jo, Worth County's rate has stopped growing, but there are four other counties showing newly upward trends. 3/9
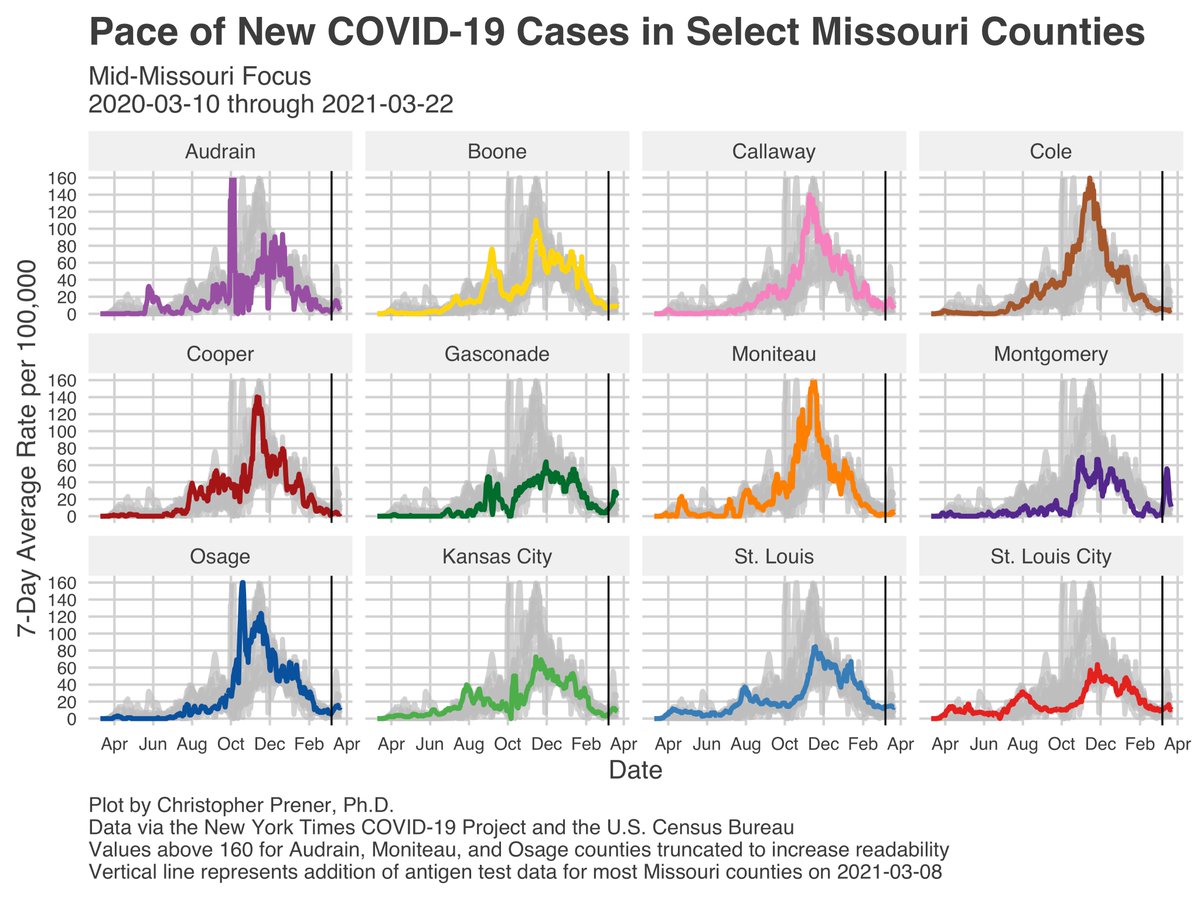
On the fringes of the #KCMO metro, Caldwell County had been seeing its 7-day average fall but it is back up and at a high for 2021. We are also seeing counties on the edge of Mid-Missouri show signs of increases - Audrain and Callaway are worth watching. 4/9
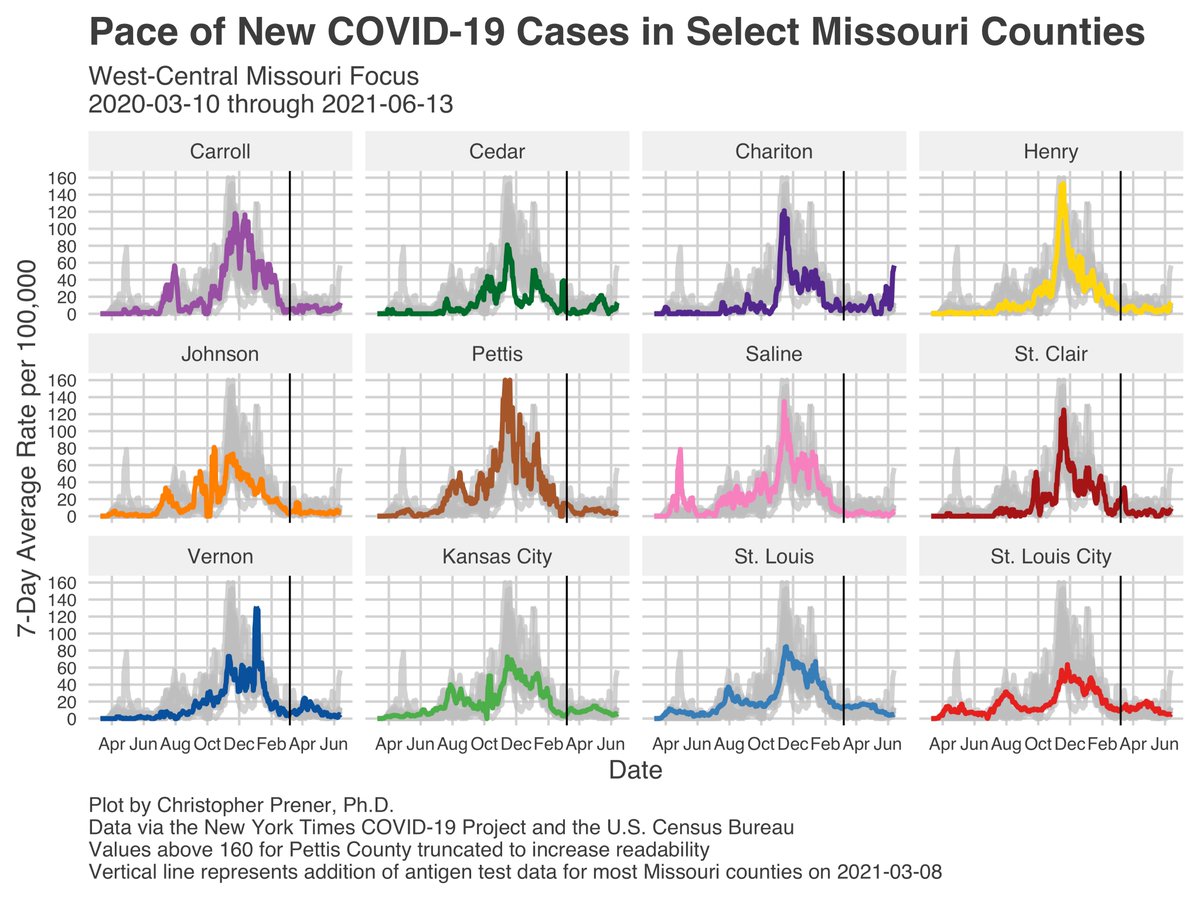
Further south, around Lake of the Ozarks, Camden, Laclede, and Miller counties are all seeing their 7-day averages climb. In the Ozarks themselves, rates are climbing in both Texas and Wright counties. 5/9
And to the southwest, Polk County remains in the nationwide top 10 for 7-day averages in counties with more than 10,000 people. Almost every county I track between the Springfield and Joplin metros is experiencing a climbing 7-day average, too. 6/9
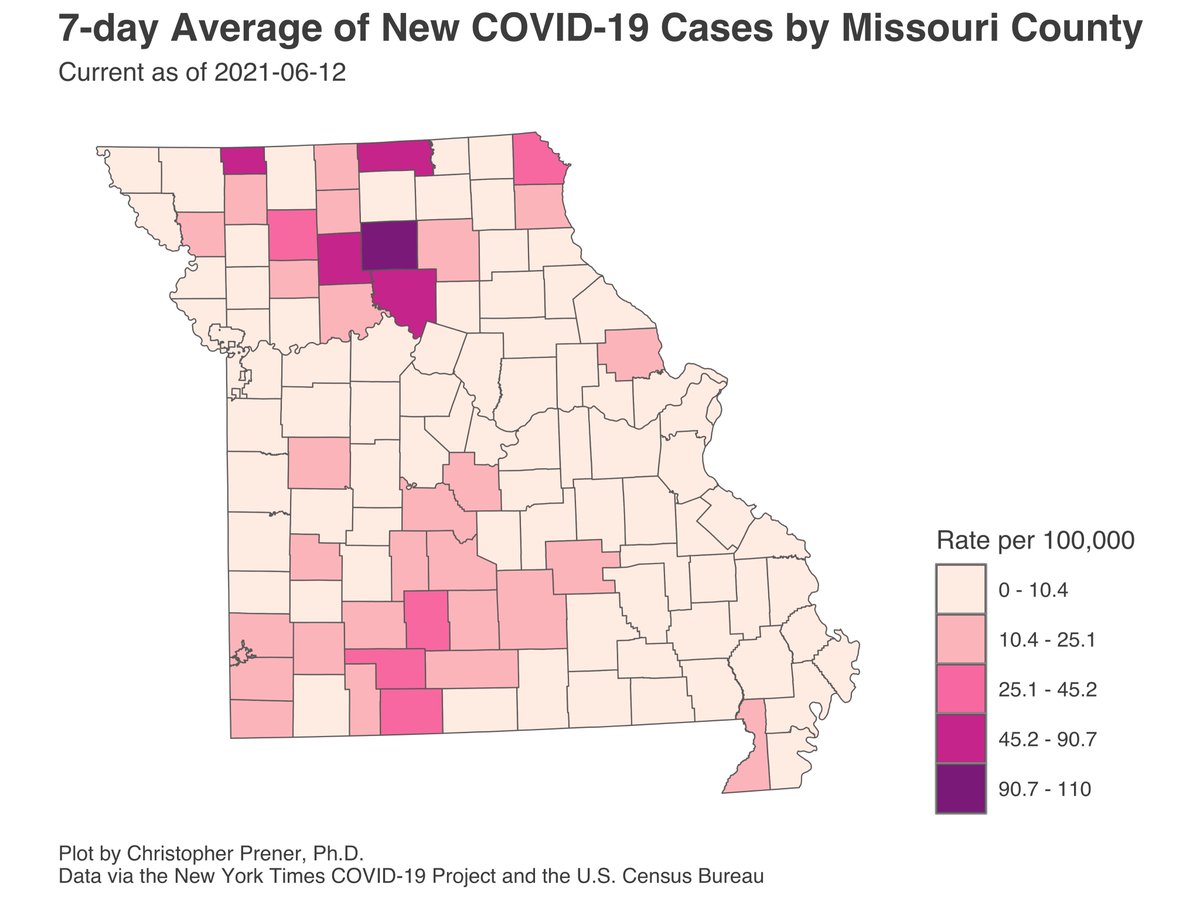
There are a few other hotspot counties scattered around, like Clark County in extreme NE MO. But as you can see from the map, Northern and Southwest MO (broadly defined) remain the areas of greatest concern. 7/9
One other thing to note - the New York Times also has Missouri as the state with the highest per capita hospitalization rates right now in the U.S.

Keep checking the tracking site - slu-opengis.github.io/covid_daily_vi… - and I'll be back with a thread on Tuesday if not beforehand. 8/9
Also, my std caveats about uncertainty - infections (1) are historical data that reflect infections 2-3 weeks ago, (2) are biased by testing patterns, (3) may include probable but unconfirmed cases in some counties, and (4) rates are not individual probabilities of illness. 9/9

• • •

Missing some Tweet in this thread? You can try to force a refresh
 

Keep Current with Chris Prener

Chris Prener Profile picture

Stay in touch and get notified when new unrolls are available from this author!

Read all threads

This Thread may be Removed Anytime!

PDF

Twitter may remove this content at anytime! Save it as PDF for later use!

Try unrolling a thread yourself!

how to unroll video
  1. Follow @ThreadReaderApp to mention us!

  2. From a Twitter thread mention us with a keyword "unroll"
@threadreaderapp unroll

Practice here first or read more on our help page!

More from @chrisprener

18 Jun
Look, if you think Sam Page is a dictator, you need to learn about life in actual authoritarian places, because Wildwood ain't one of them.

Let's work through a few things here, though, setting aside the a-historical "dictator" analysis. 1/
First, emergency powers are common in all democracies for dealing with a range of threats, from wars to disasters, terrorist attacks, and pandemics. And there are legitimate critiques we can make of them (see Giorgio Agamben's work, for example). 2/ press.uchicago.edu/Misc/Chicago/0…
But public health emergency orders are established and accepted tools for managing collective crises where "the situation is exigent, the anticipated or potential harm would be calamitous, and the harm cannot be avoided through ordinary procedures." 3/ nejm.org/doi/10.1056/NE…
Read 11 tweets
16 Jun
I’ve updated my #Missouri #COVID19 website for Tuesday, 6/15 - slu-opengis.github.io/covid_daily_vi…. Quite a few highlights are below 👇.

The growth you can see in the statewide 7-day average, placing us tied for no. 3 nationally, is almost entirely from “outstate” MO. 1/17
The two regions I am most concerned remain the same: Northern Missouri and Southwest Missouri. That said, the number of counties in those areas that I'm watching has grown considerably over the past week. 2/17
In Northern MO, Putnam and Livingston counties are seeing their rates fall, but Linn County remains no. 2 nationally (for jurisdictions with more than 10,000 people) because of its rate of new cases. Mercer is a new county to watch as well. 3/17
Read 17 tweets
15 Jun
I’ve fully updated my #Missouri #COVID19 website for Monday, 6/14 - slu-opengis.github.io/covid_daily_vi….

Our 7-day average statewide and in “outstate” Missouri continues to climb. Missouri is currently tied for third (with Utah) in terms of state-level rates of new cases.

1/4 ImageImageImageImage
I’ll give a full update tomorrow, but new counties in both Northern and SW MO are experiencing sharp increases - Chariton and Worth counties, for example, in Northern MO. 2/4 ImageImageImageImage
In #StLouis, rates remain quite low, but we’ve returned to relatively higher rates in North City and North County in particular. 3/4 Image
Read 4 tweets
14 Jun
My #Missouri #COVID19 website has been fully updated for Sunday, 6/13 - slu-opengis.github.io/covid_daily_vi…. As a reminder, I'm doing slightly more frequent threads again since 7-day averages are growing again.

The 7-day averages statewide and “outstate” crept up a bit again yesterday. 1/8 ImageImageImageImage
The general areas of concern remain the same - Northern MO and parts of Southwest MO, but the number of counties with concerning trends has grown over the past few days in SW MO in particular. 2/8 Image
In Northern MO, Putnam County’s superlative rates have fallen sharply, as have rates in Linn and Livingston counties. Linn’s rate remains no. 2 nationwide for counties with more than 10,000 residents. 3/8 ImageImageImage
Read 8 tweets
25 Mar
I’ve got a few thoughts on the mass vax event I was at today at STLCC’s Forest Park campus.

The excellent - we got vaccinated! 🥳

The great - the @Missouri_NG, @MoSEMA_ DMAT, @SLMPD personnel (including recruits, I think?), and volunteers were all super friendly. 1/12
Once you reached the inside of the gymnasium, the check-in, paperwork, vaccination, and post-vax 15 minute waiting period were all really smooth, well-organized, and efficient. 2/12
This gets me to the bad - it took awhile to get to that point. We'll start with sign-up you picked an appointment (in half-hour blocks) but the email did not tell you how to drive into the site, where to park, and did not provide your appointment time. 3/12
Read 12 tweets
24 Mar
I’ve updated my #Missouri #COVID19 website for Tuesday, 3/23 - slu-opengis.github.io/covid_daily_vi…. A few highlights, and *new* hospitalization plots, are below 👇.

We saw continued declines in #KCMO and “outstate” but did see a slight bump in new cases in the #StLouis metro area. 1/15 ImageImageImageImage
We’re now two weeks out from the addition of antigen cases and have seen no real overall change in our current 7-day averages ☝️. This is great news from a tracking perspective, and means our sense of the virus over the past few weeks was not distorted. 2/15
I mentioned a small number of counties that I was concerned about last week. Montgomery County, in Mid MO, has seen its rate of new cases decline just as precipitously as it climbed last week. 3/15 ImageImage
Read 15 tweets

Did Thread Reader help you today?

Support us! We are indie developers!


This site is made by just two indie developers on a laptop doing marketing, support and development! Read more about the story.

Become a Premium Member ($3/month or $30/year) and get exclusive features!

Become Premium

Too expensive? Make a small donation by buying us coffee ($5) or help with server cost ($10)

Donate via Paypal Become our Patreon

Thank you for your support!

Follow Us on Twitter!

:(